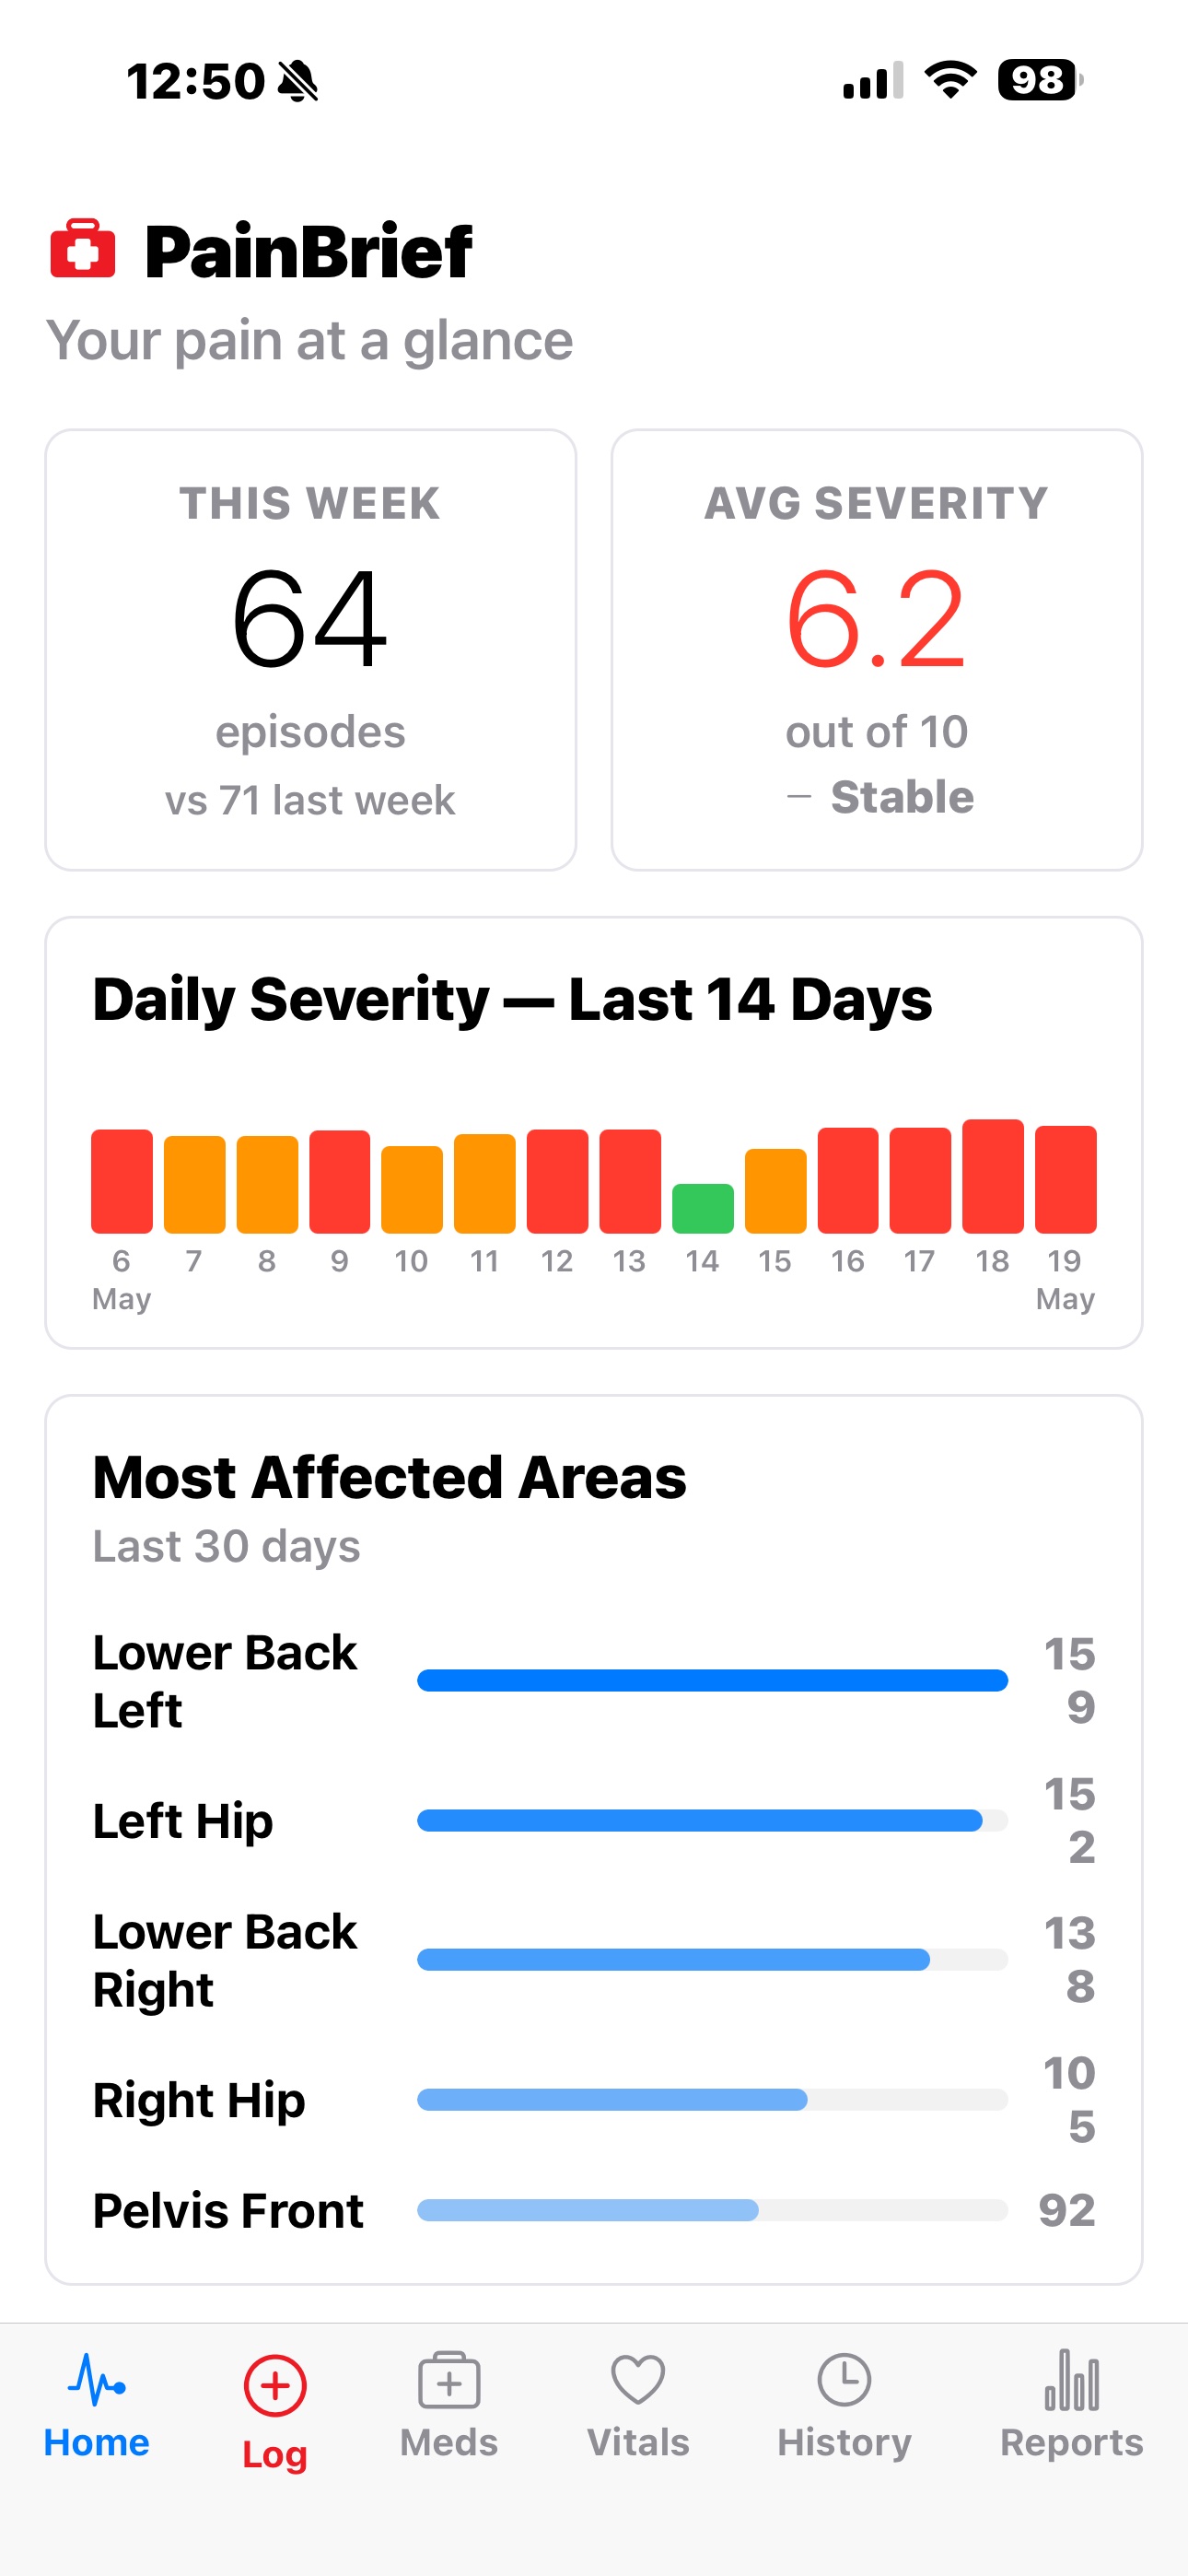
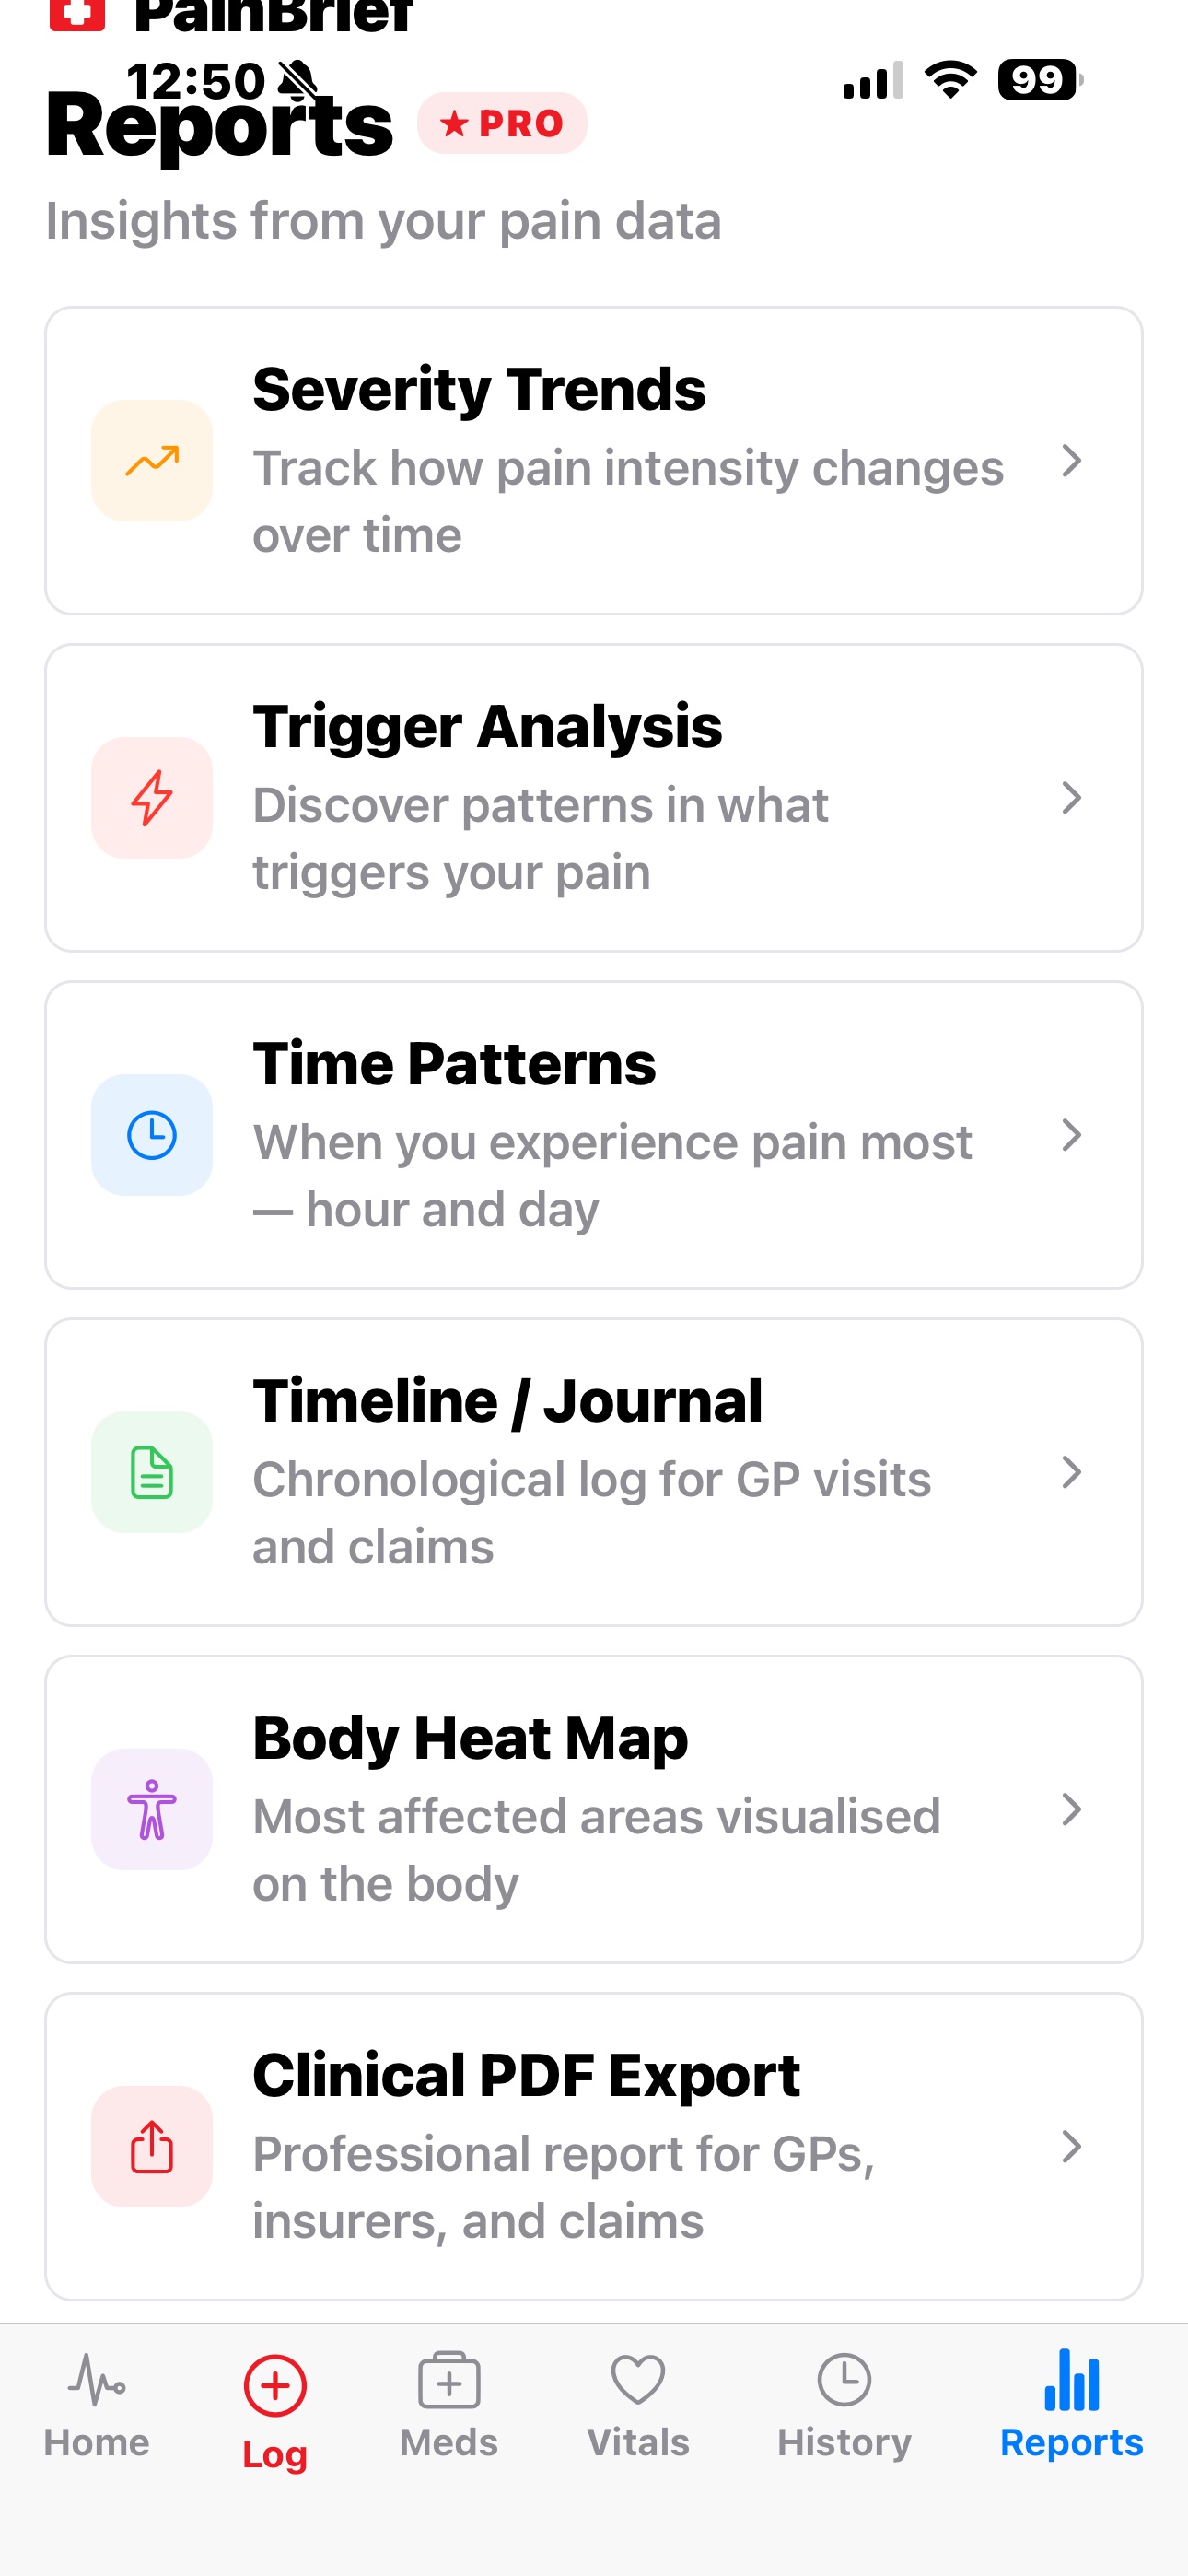
Detailed pain reports you can share with your healthcare team.
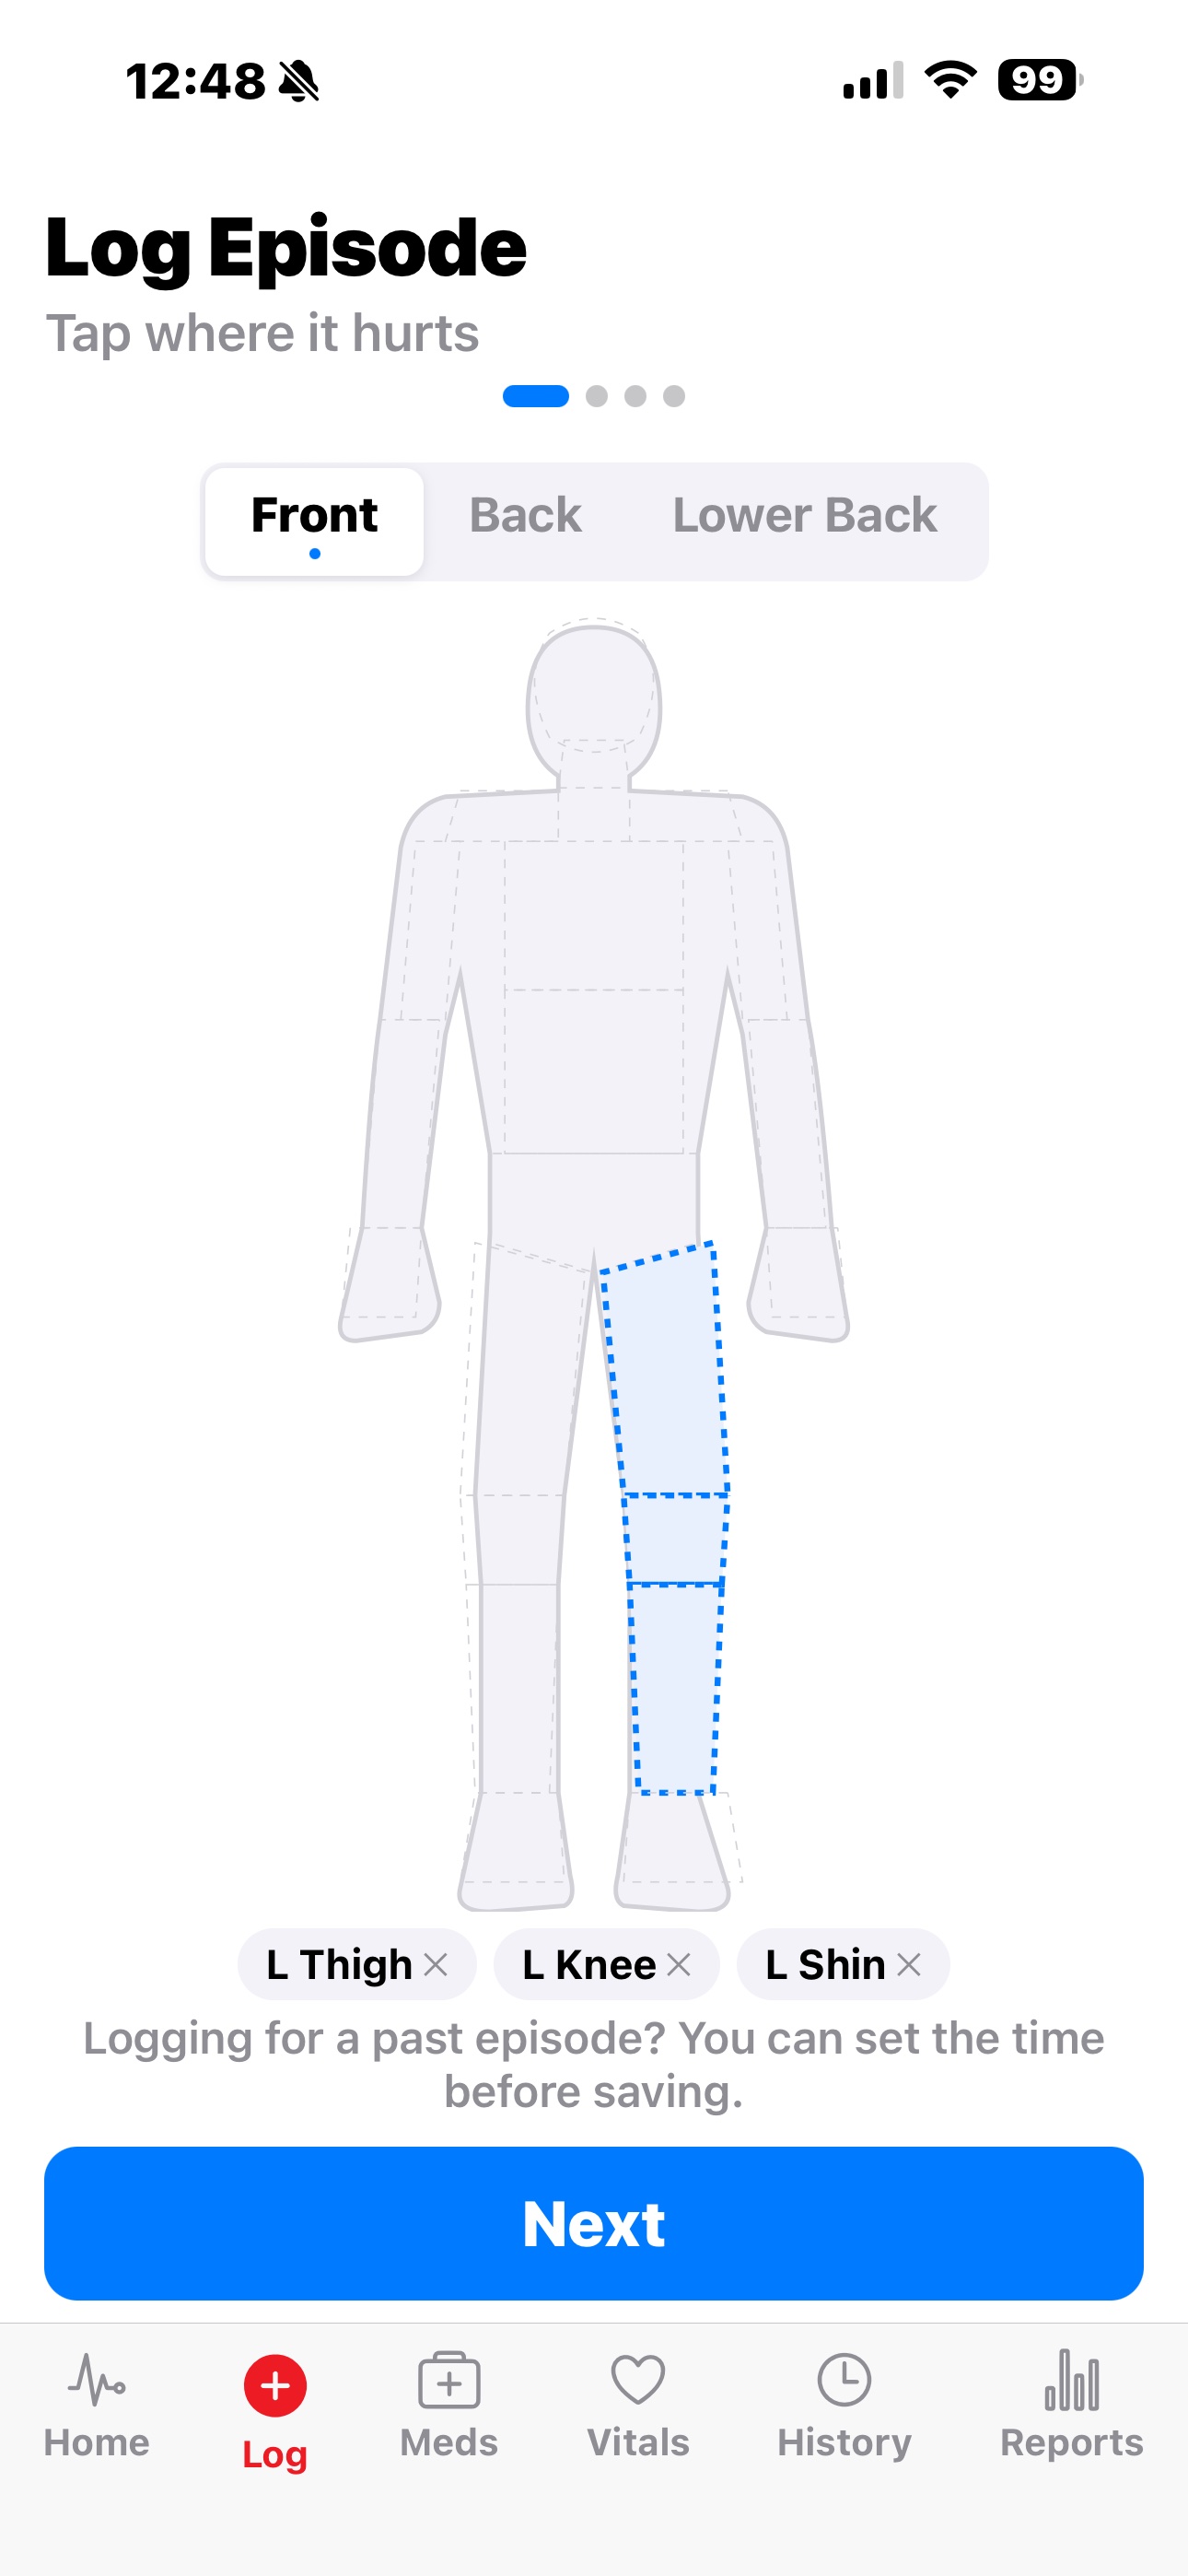
Front, back, and lower-back views with 40+ tap zones.
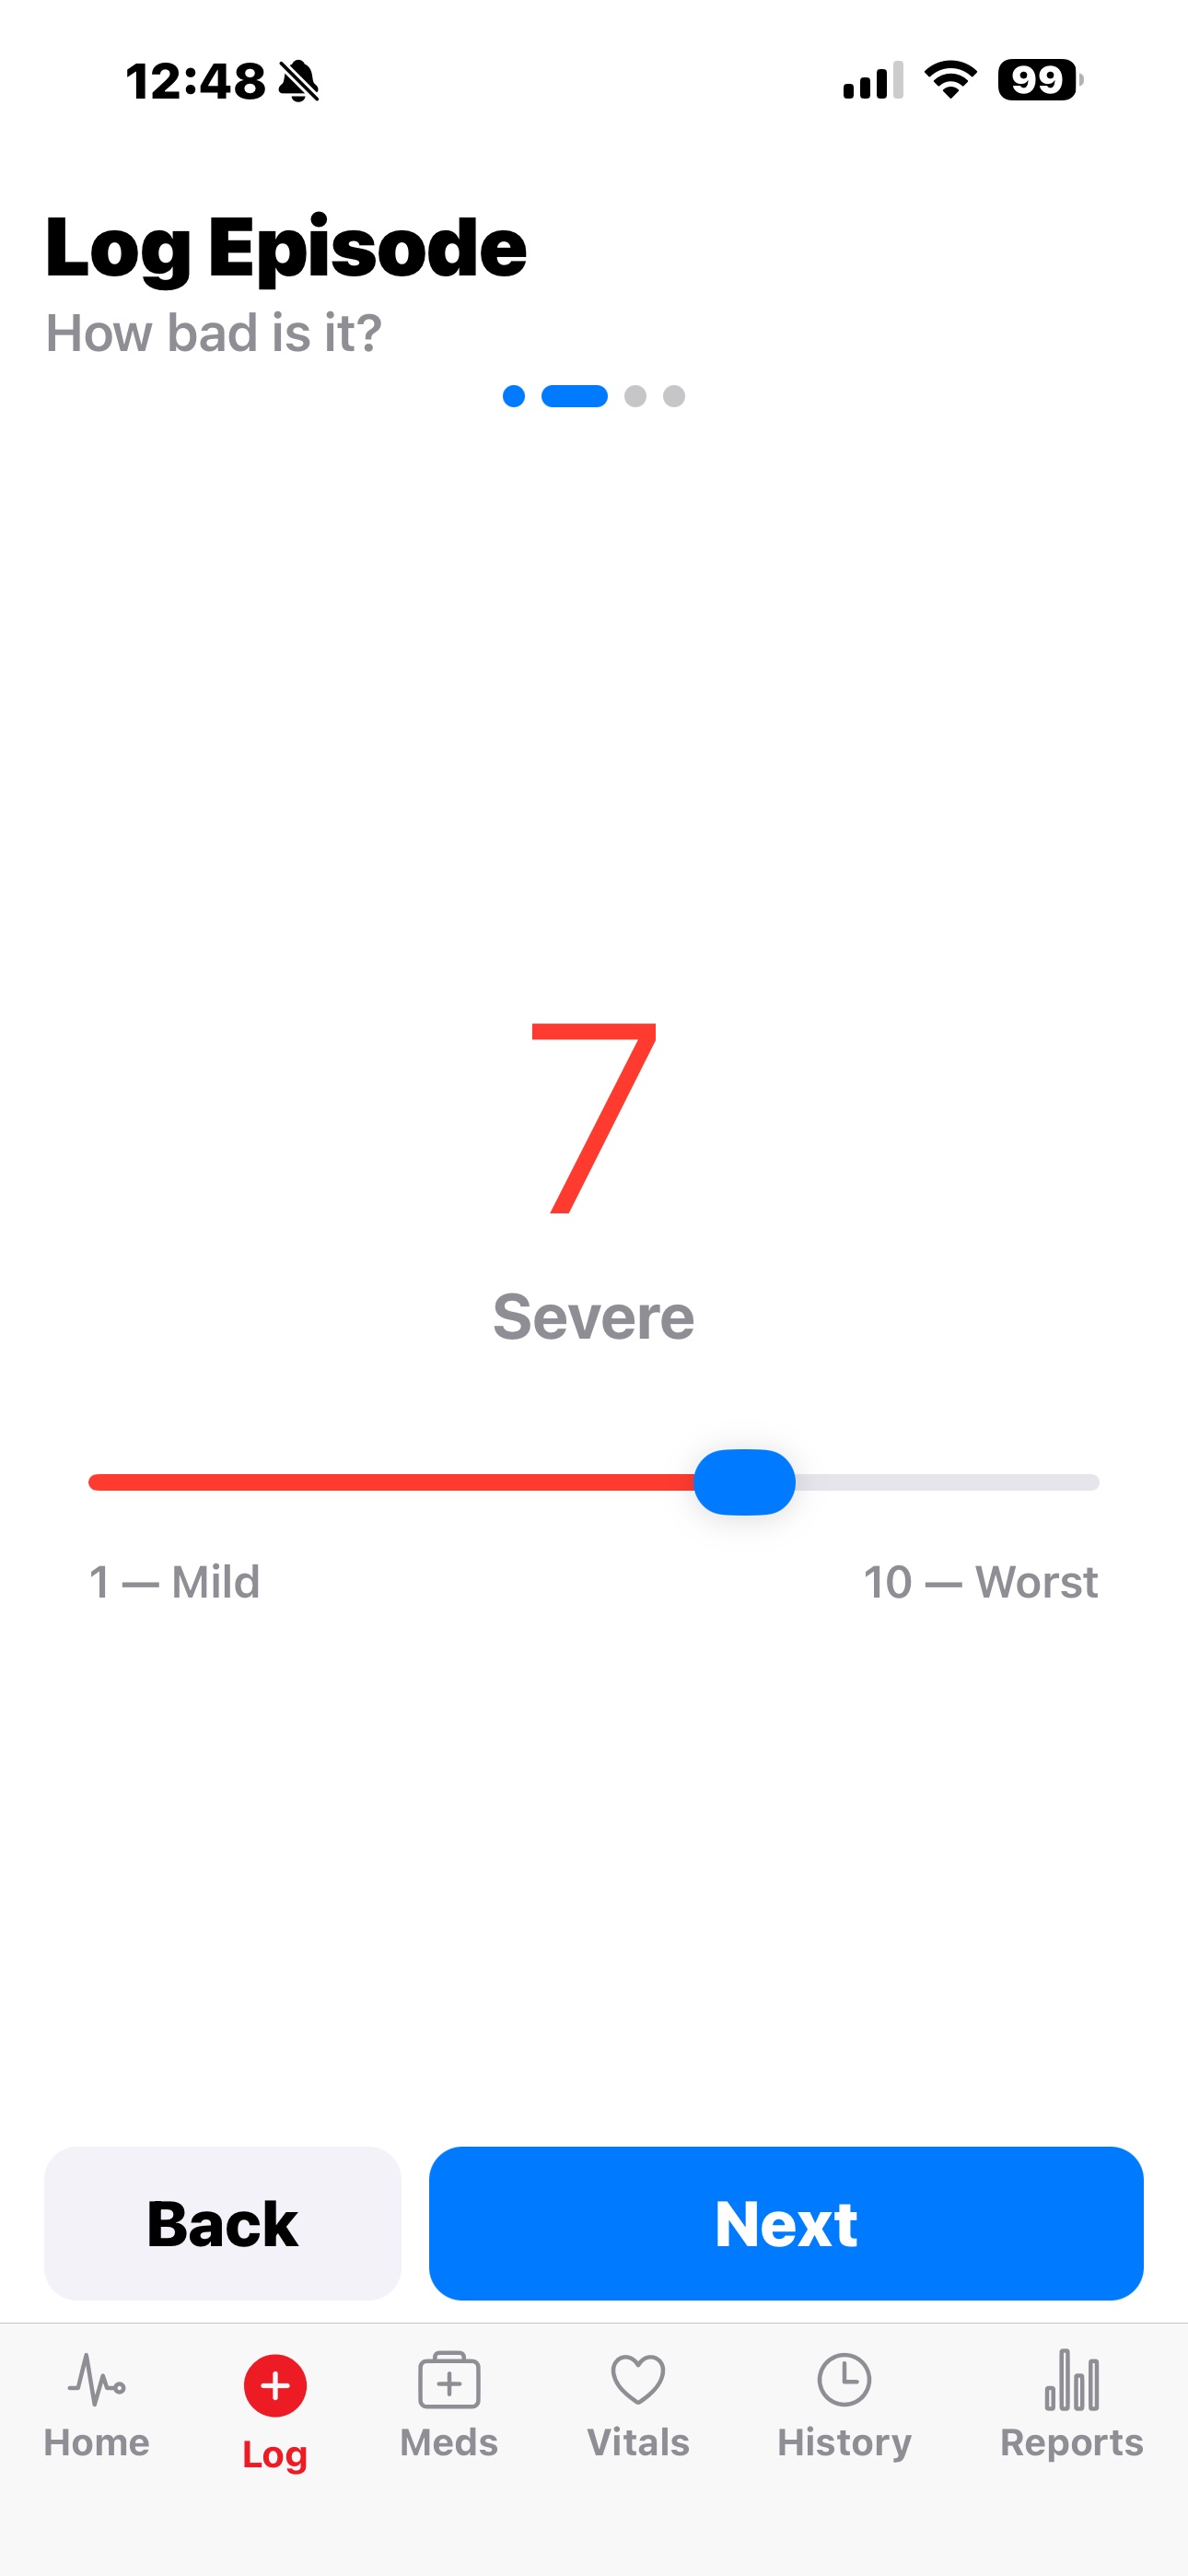
1 to 10, with plain-English labels from Mild to Worst.
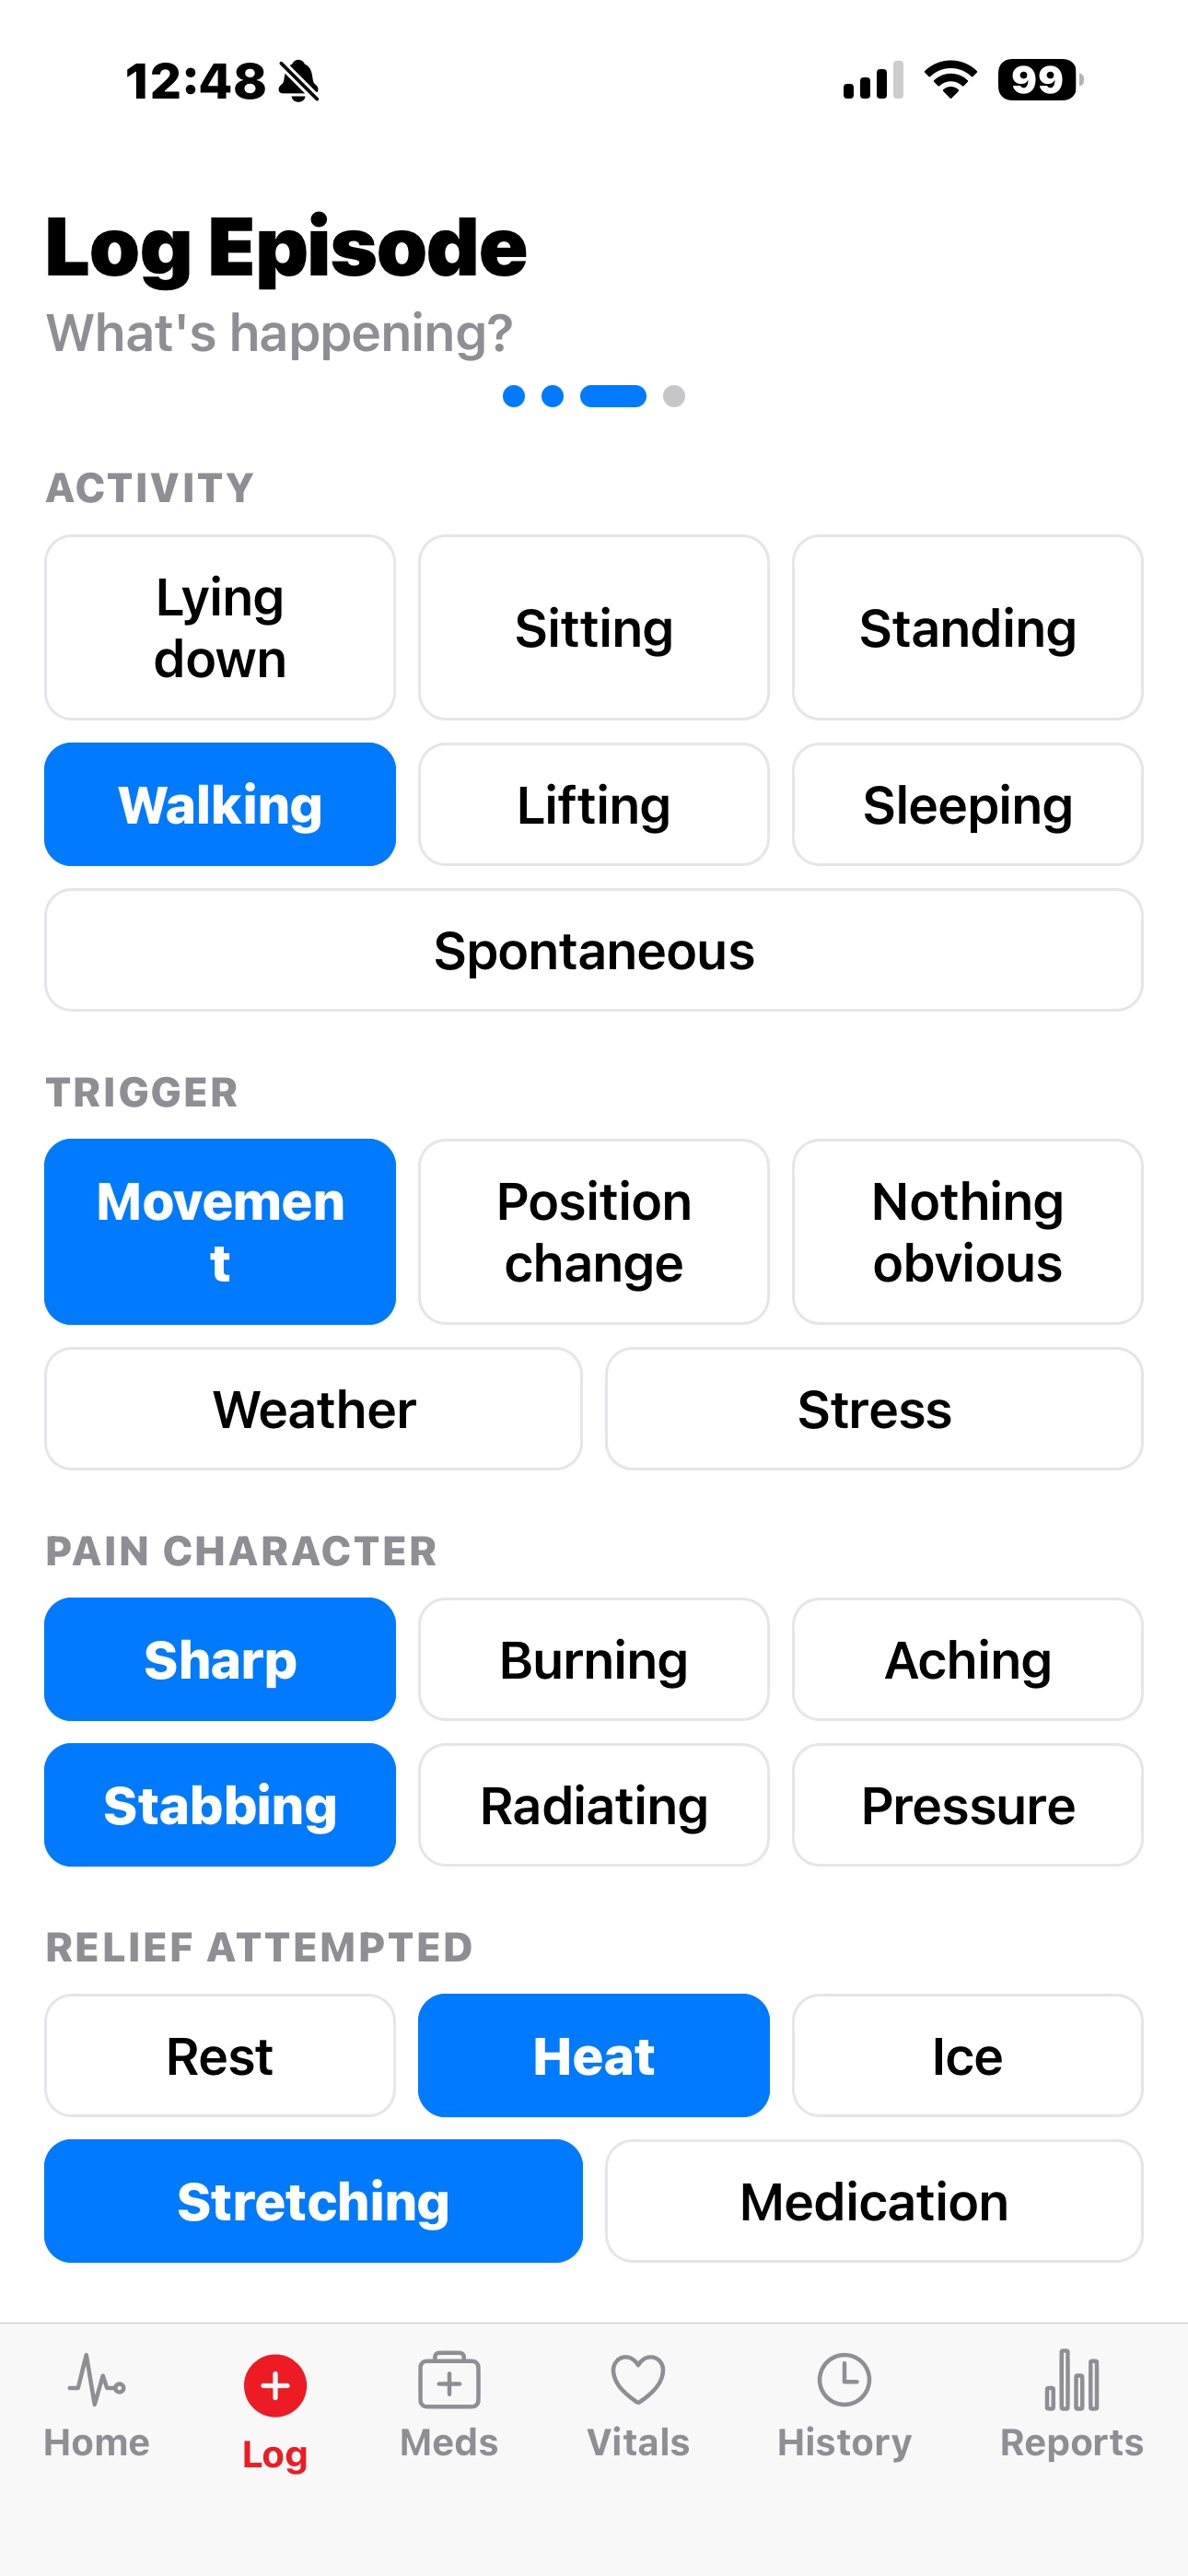
Activity, trigger, pain character, what helped.
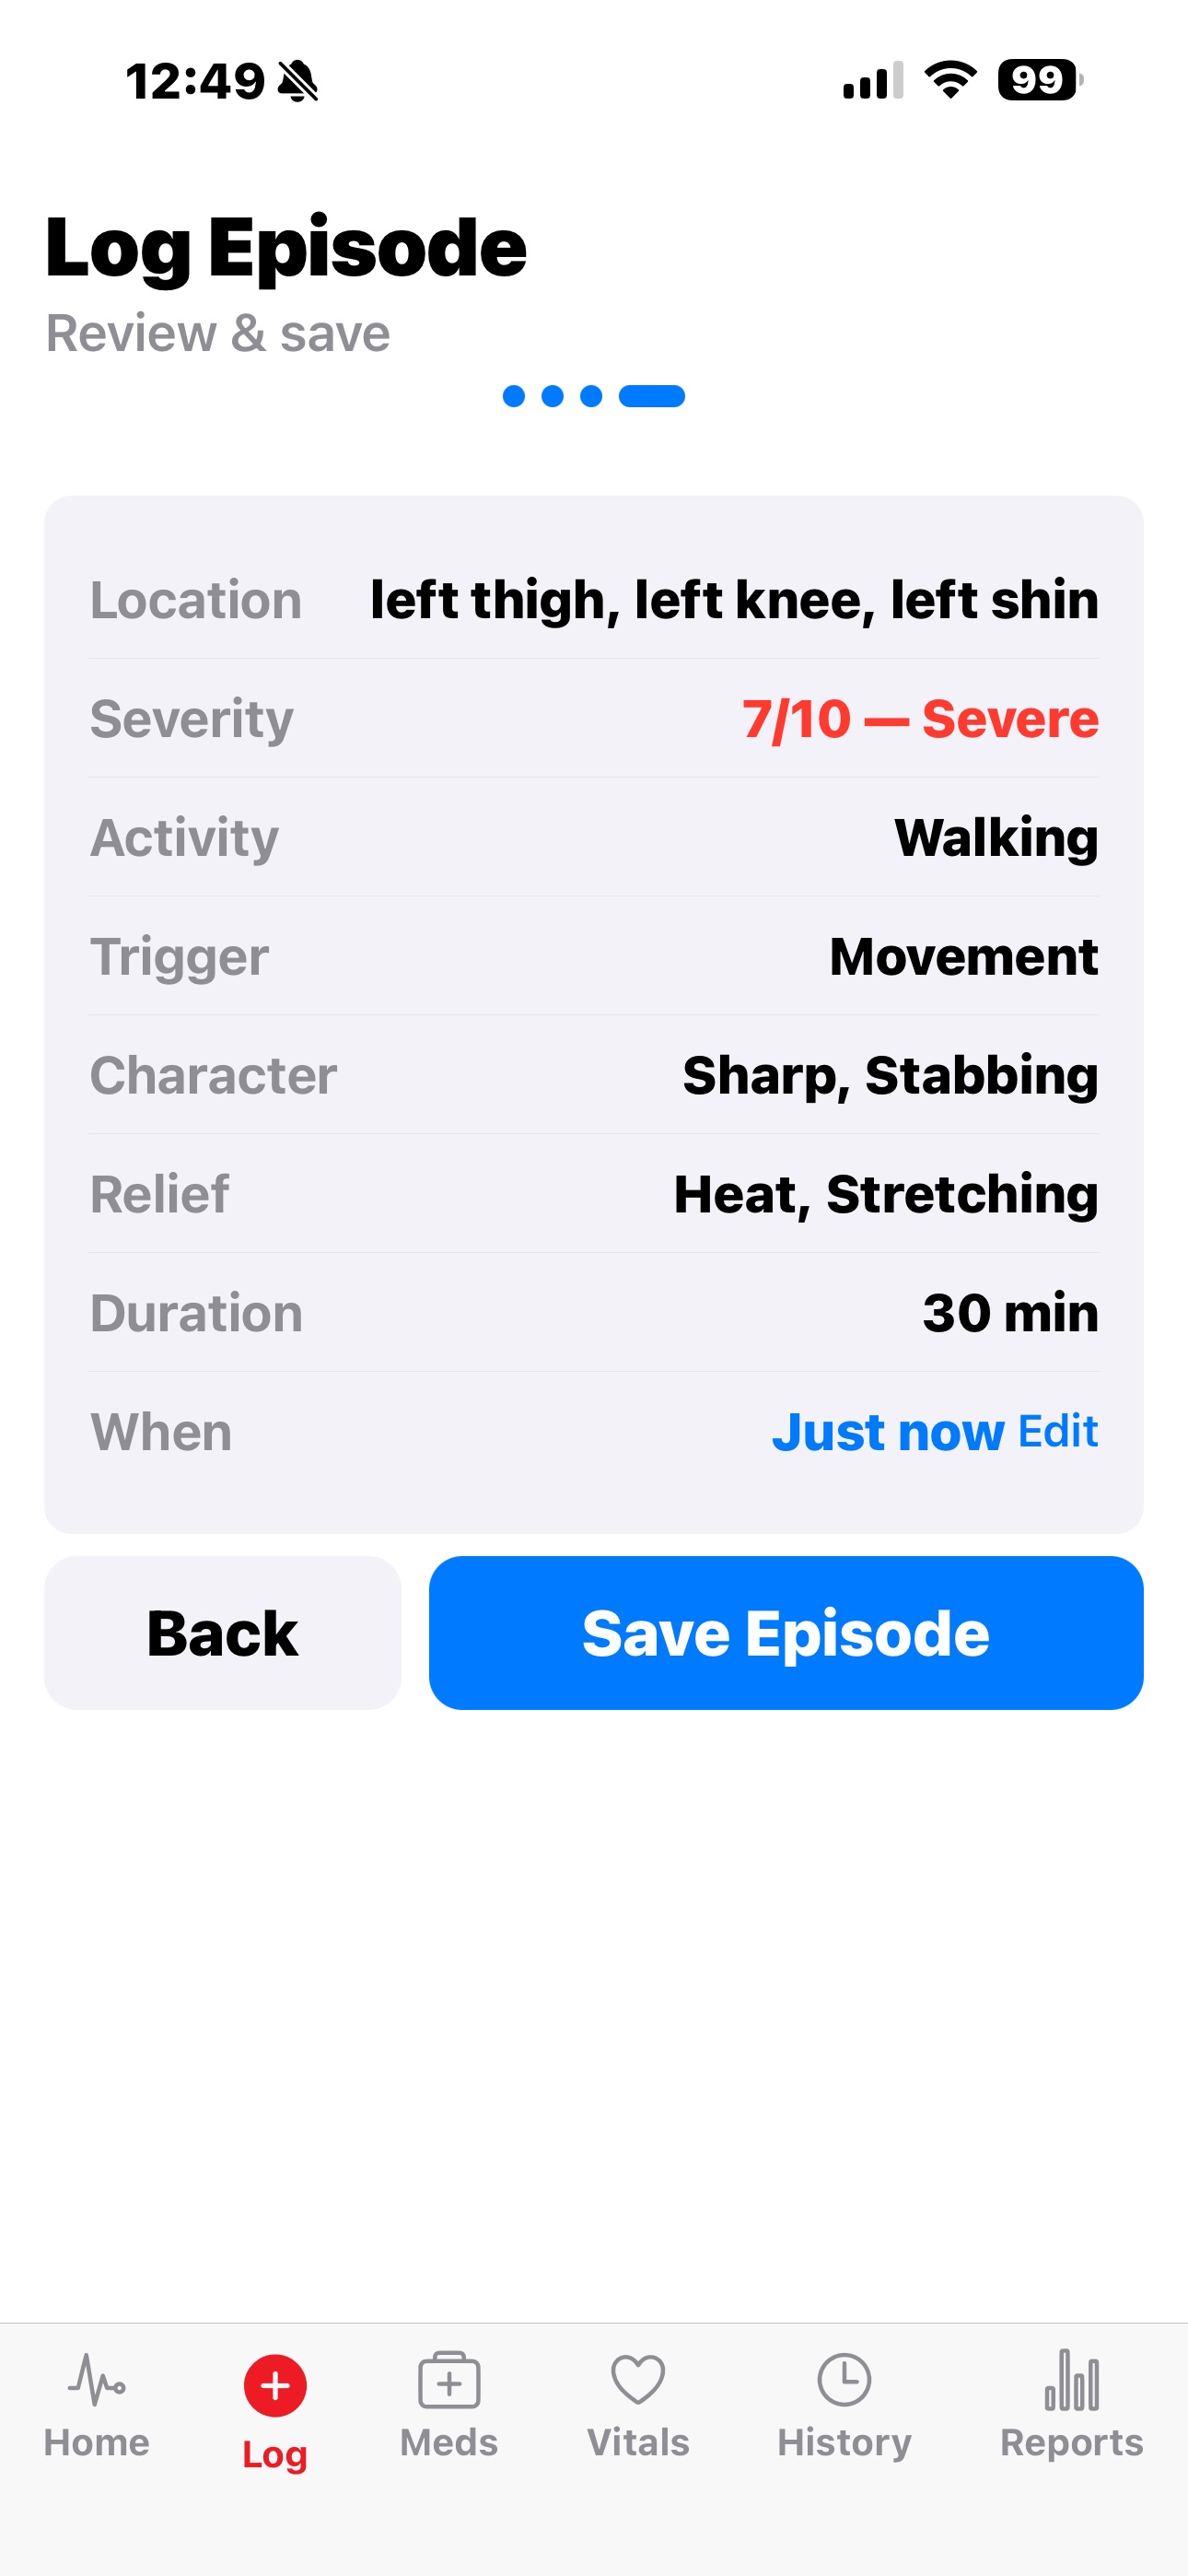
Confirm or adjust the time, then save.
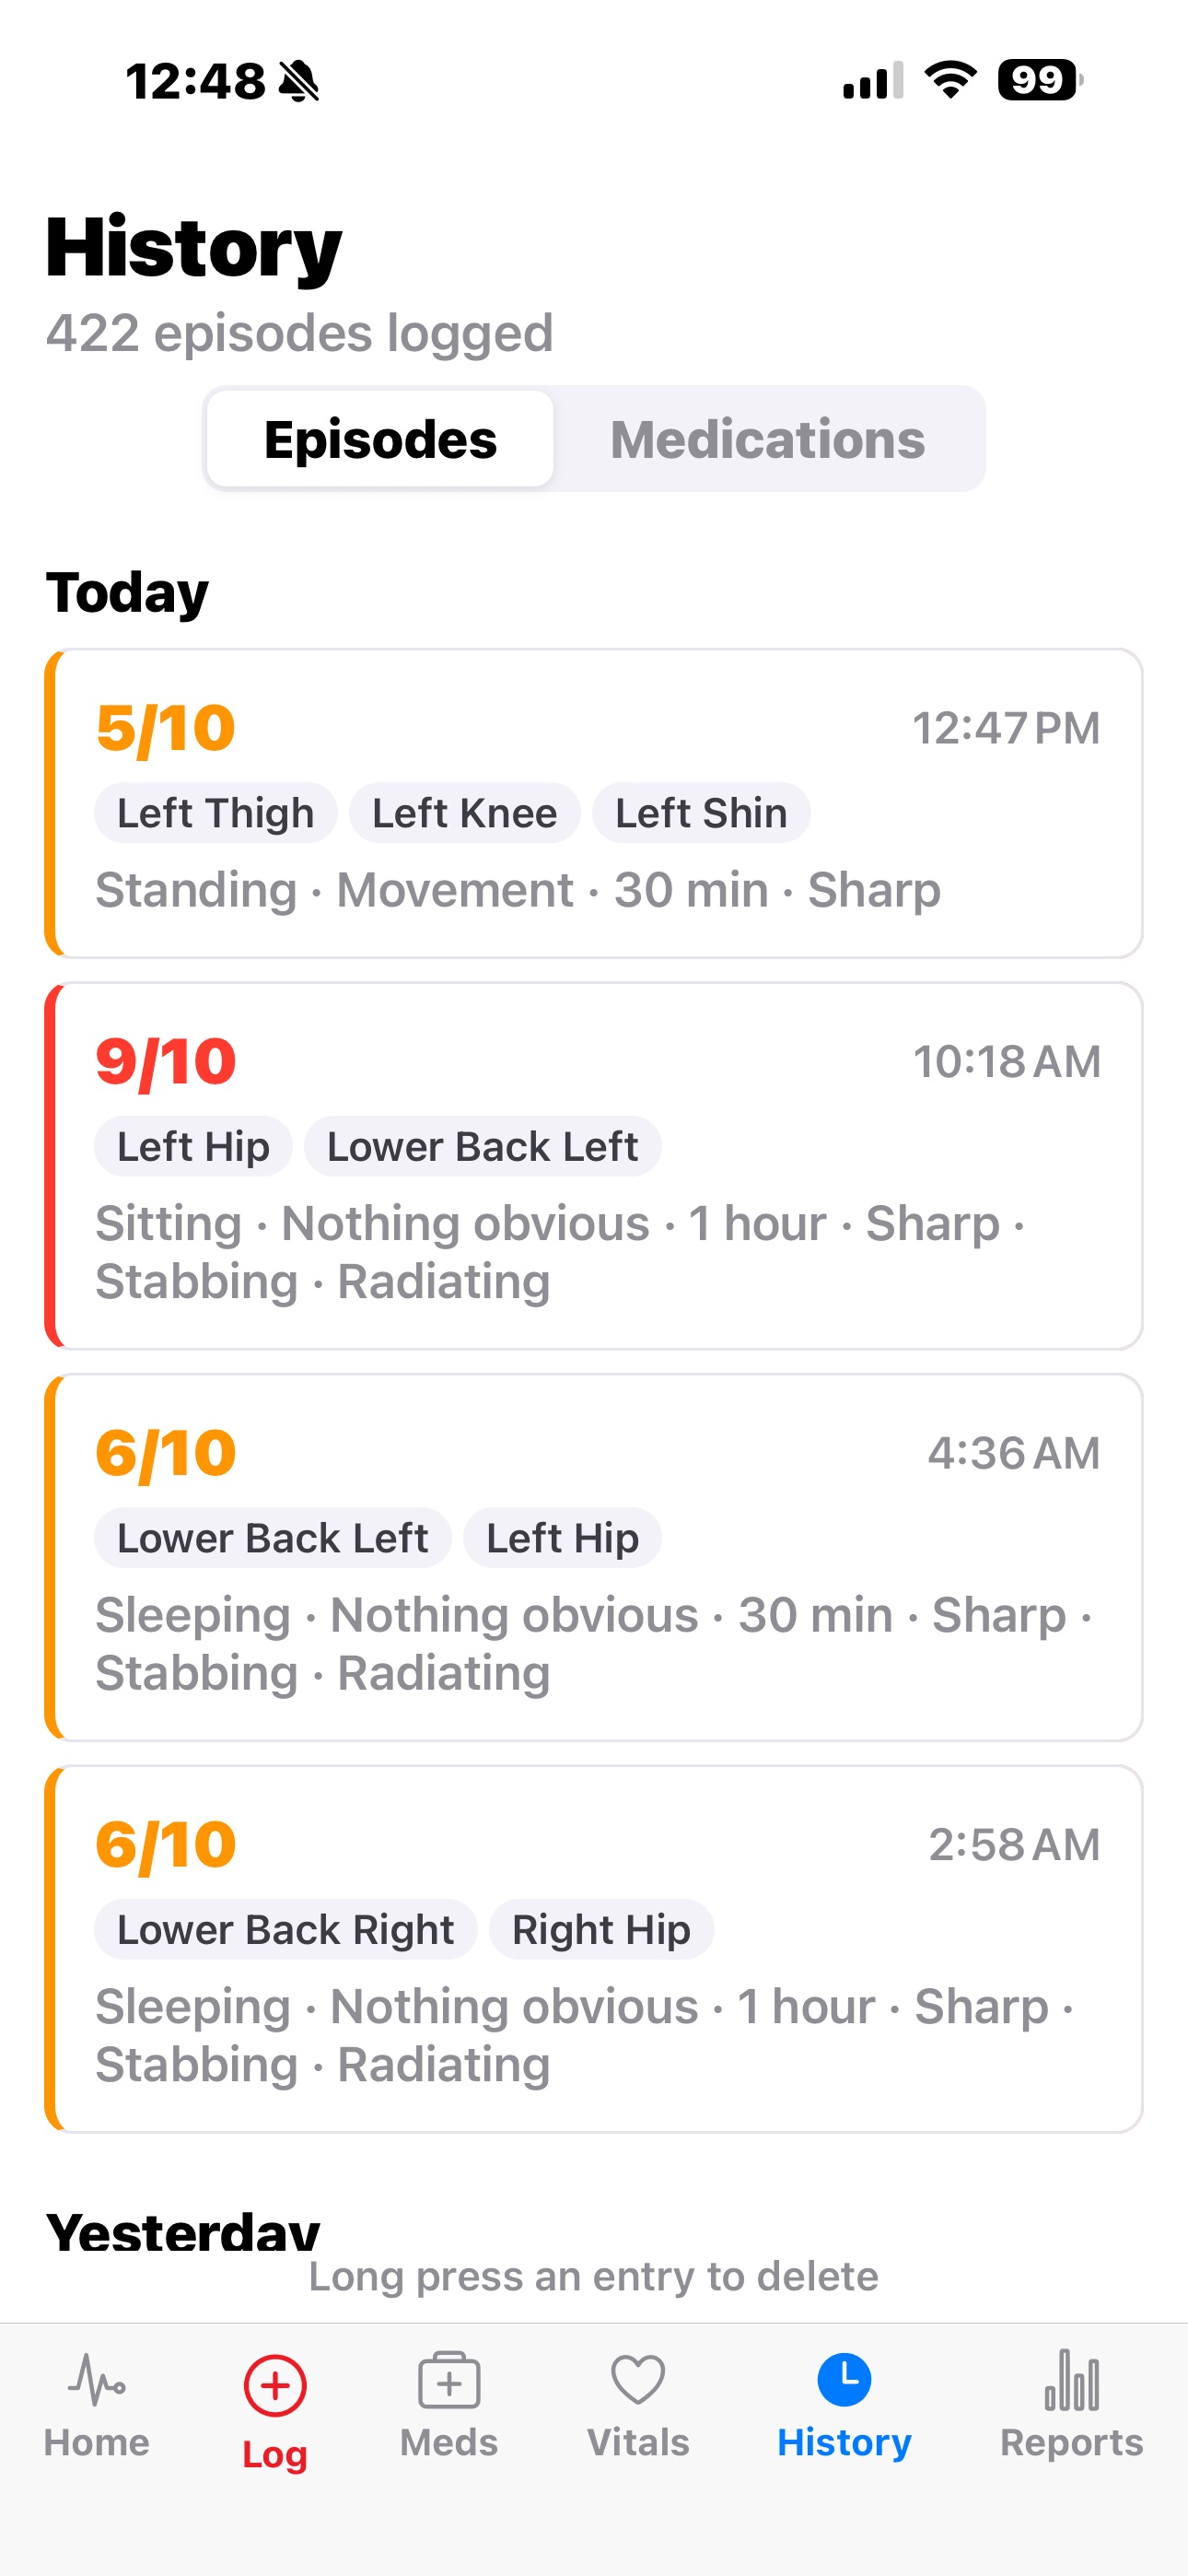
Every episode you've ever logged, grouped by day. Hundreds of entries, scrollable and searchable.
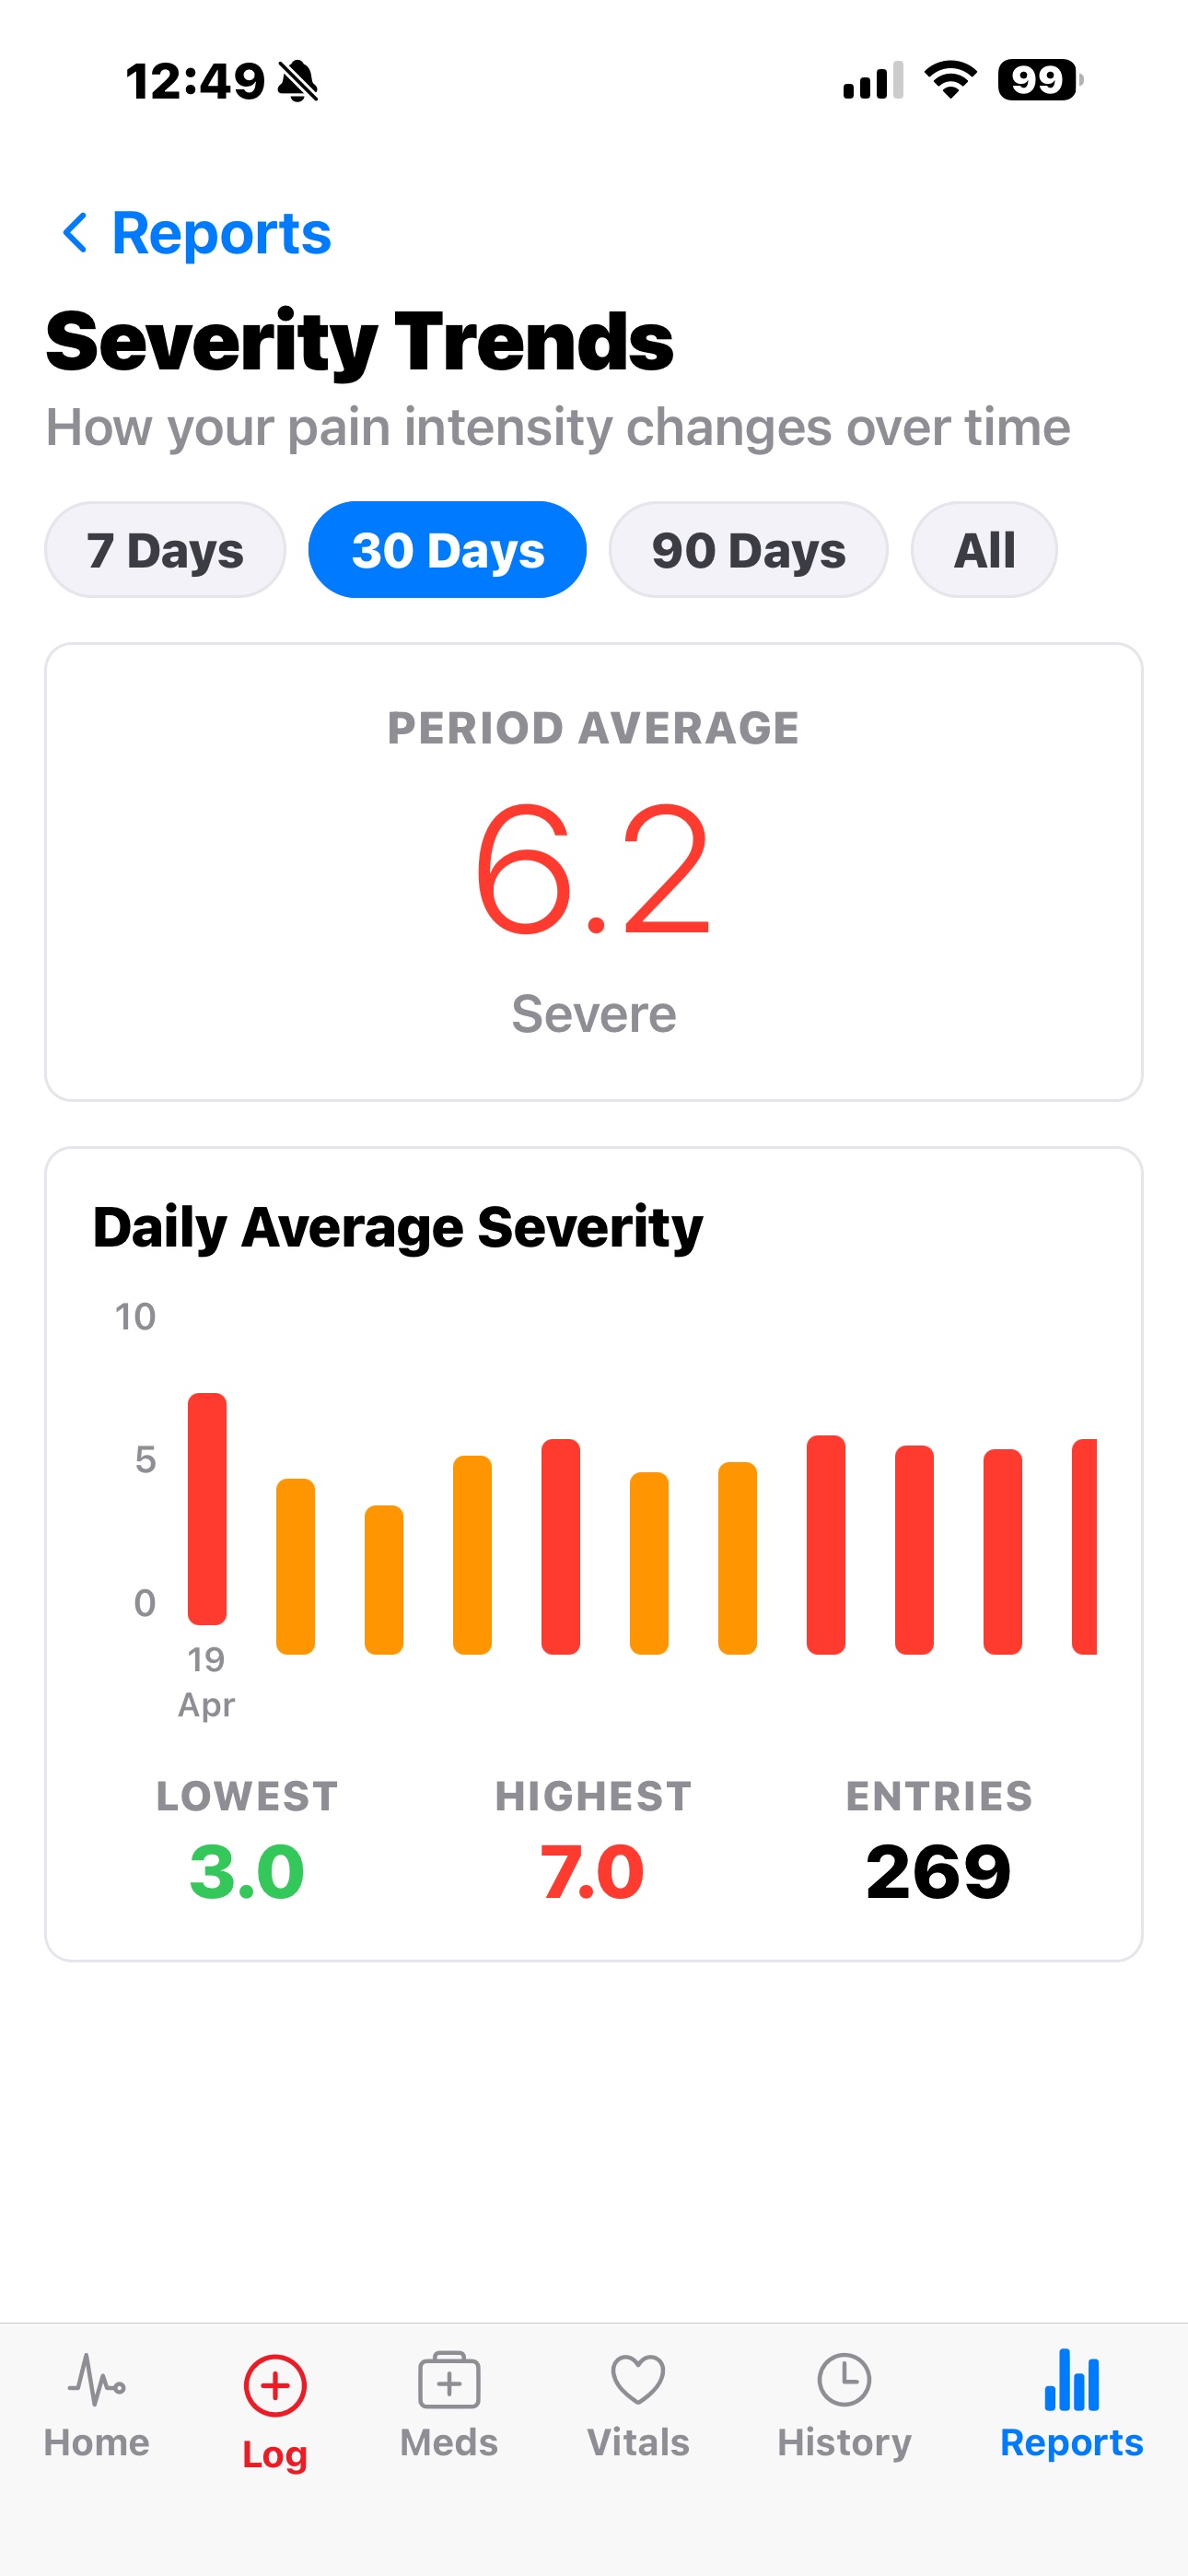
See whether things are getting better or worse over 7, 30, or 90 days. Daily averages, highs, lows, and entry counts.
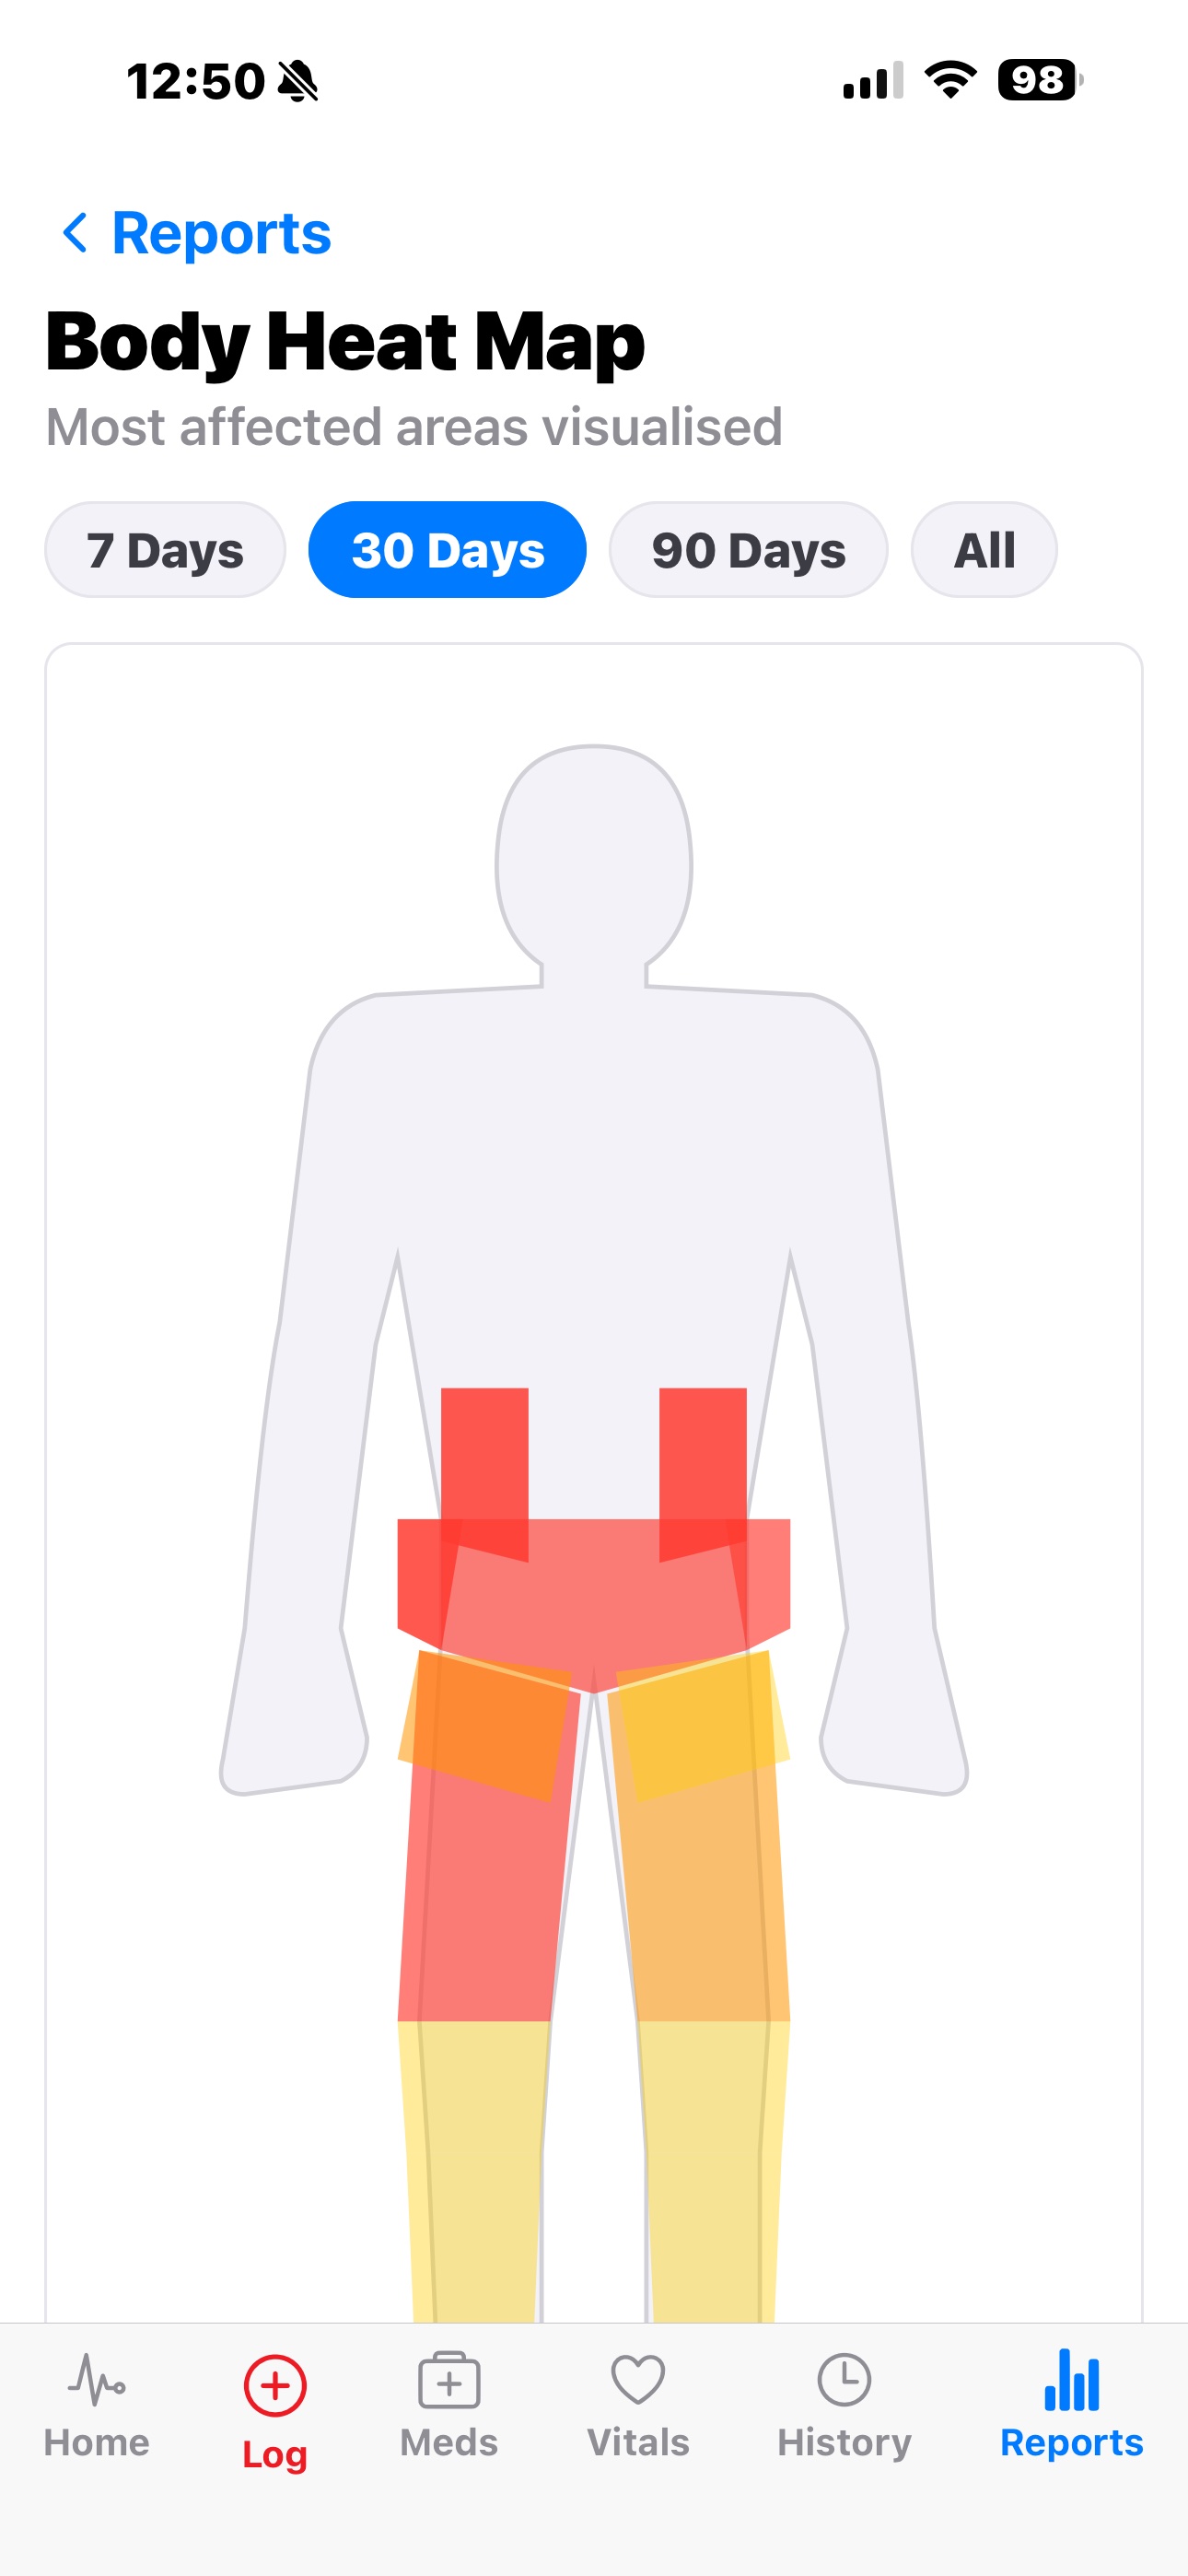
Your most affected zones rendered on an anatomical view — the same visual your GP can see at a glance.
Plus medication tracking, dose logging, Apple Health integration for vitals, and reminders — all free, all on your device.
Free PainBrief helps you see that pain is happening. Pro helps you understand why, and gives you a polished clinical report to take to the people who can help.
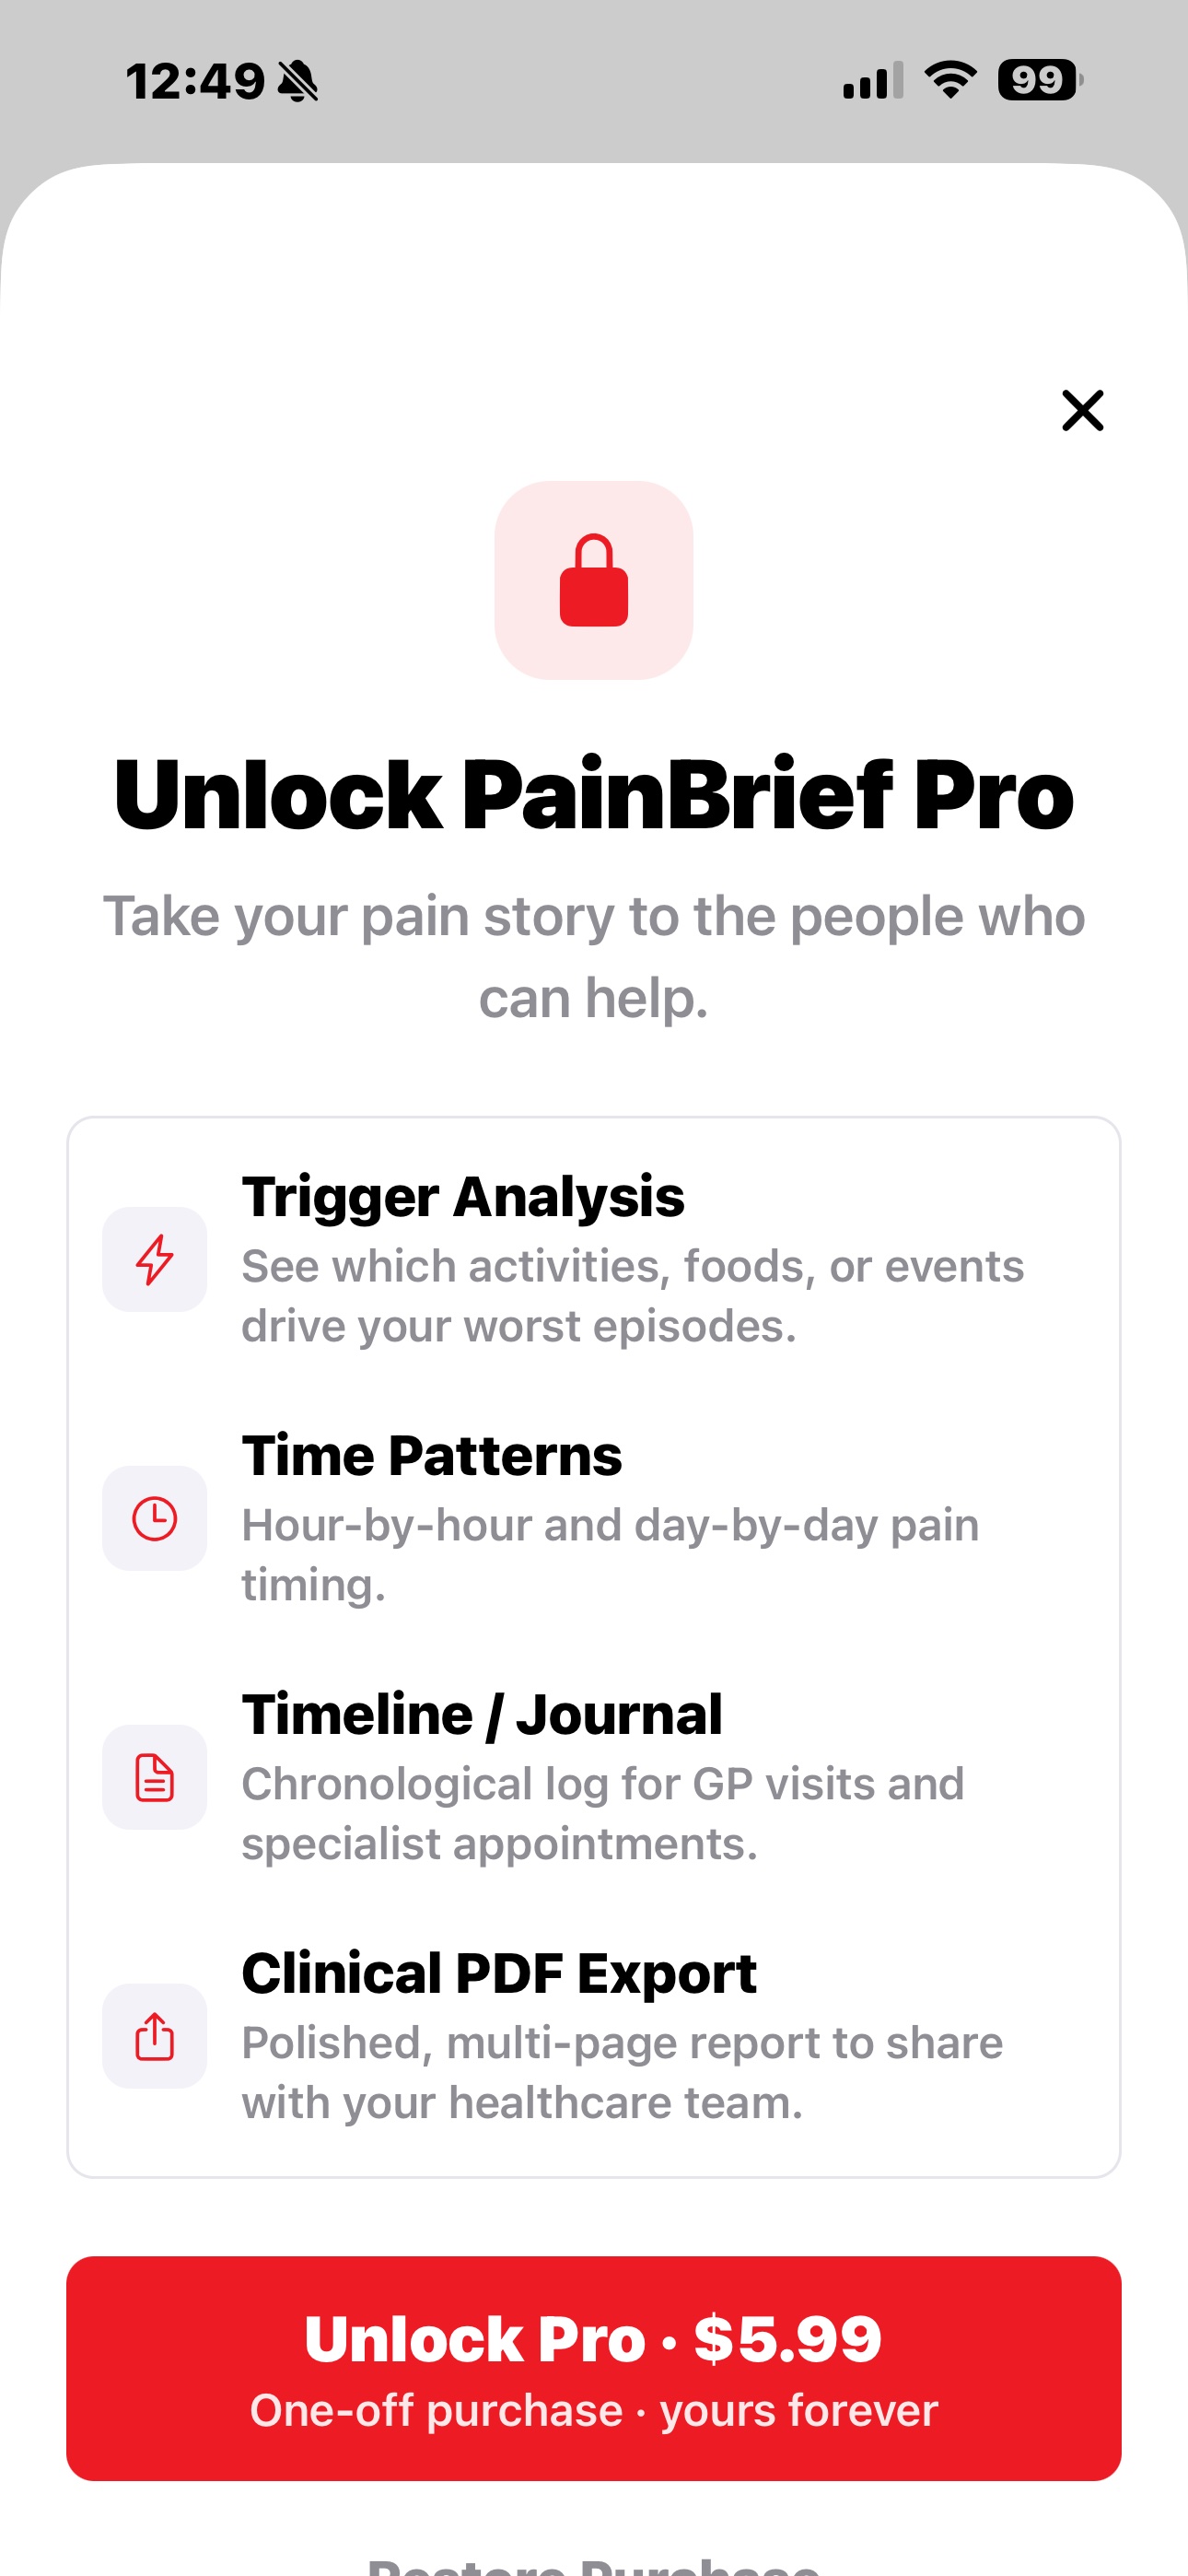
No subscriptions. No recurring charges. Pay once, unlock the deeper analytics and the Clinical PDF Export, and it stays with your Apple ID across every device, forever.
Restore on any new device via the Restore Purchase button.
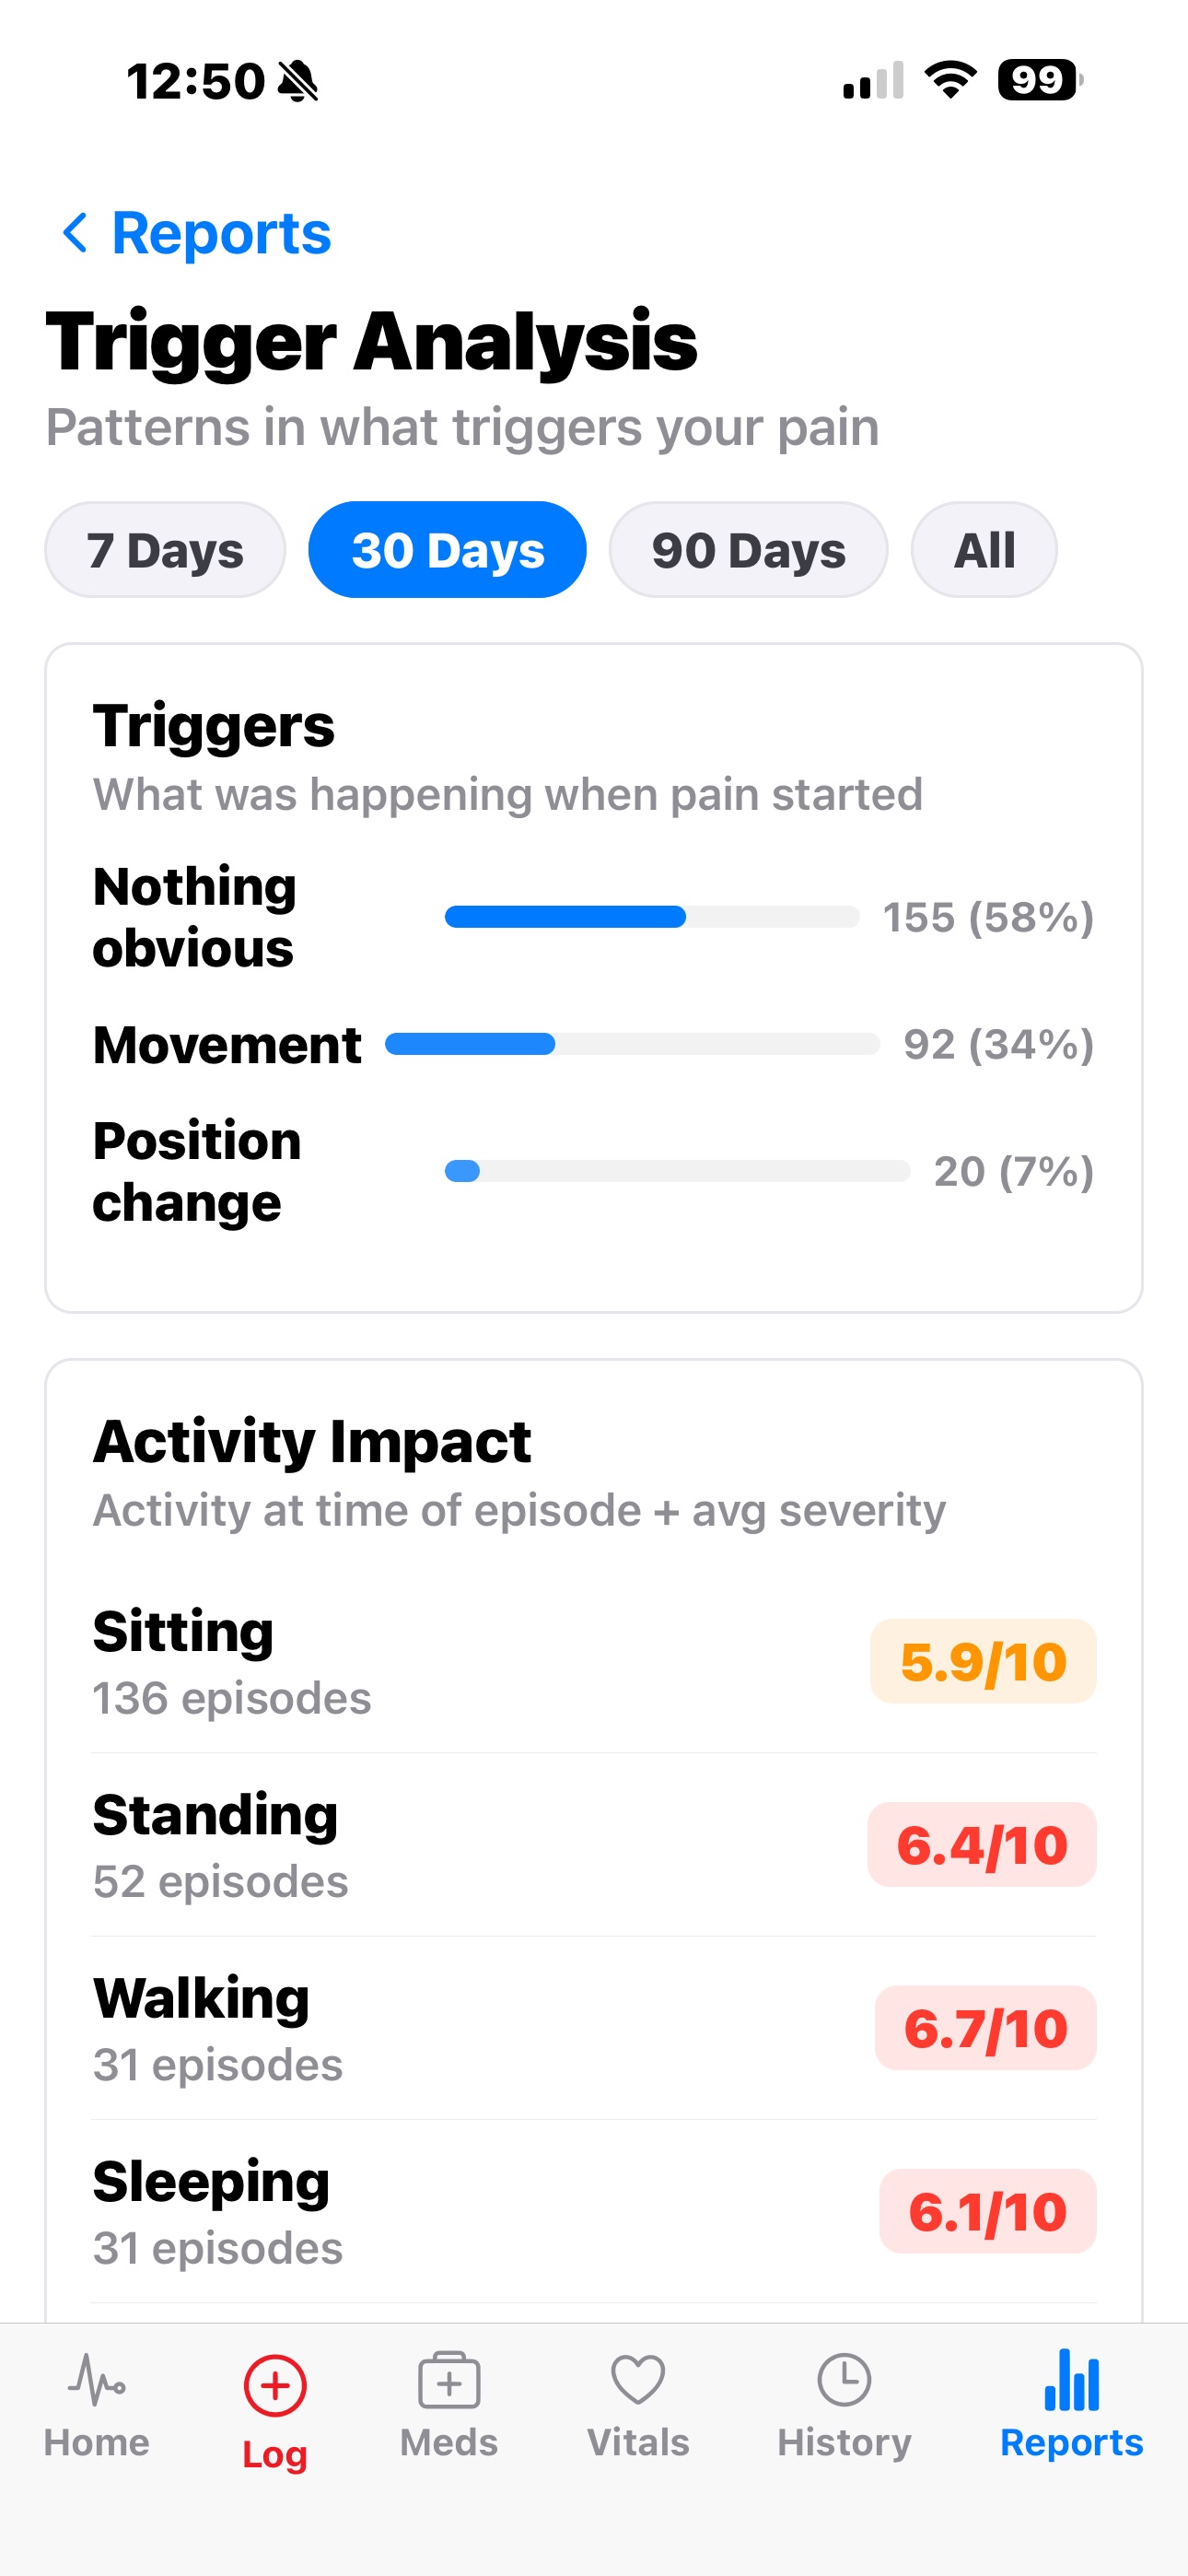
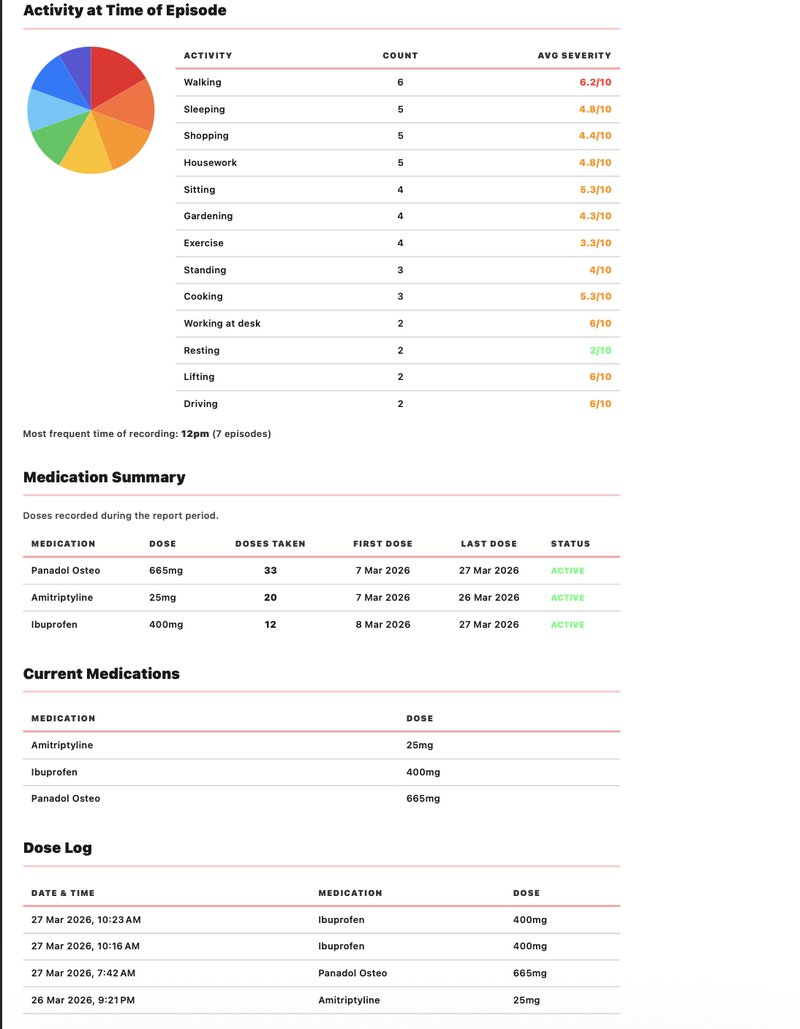
See which activities, foods, weather, and events drive your worst episodes — with average severity per activity.
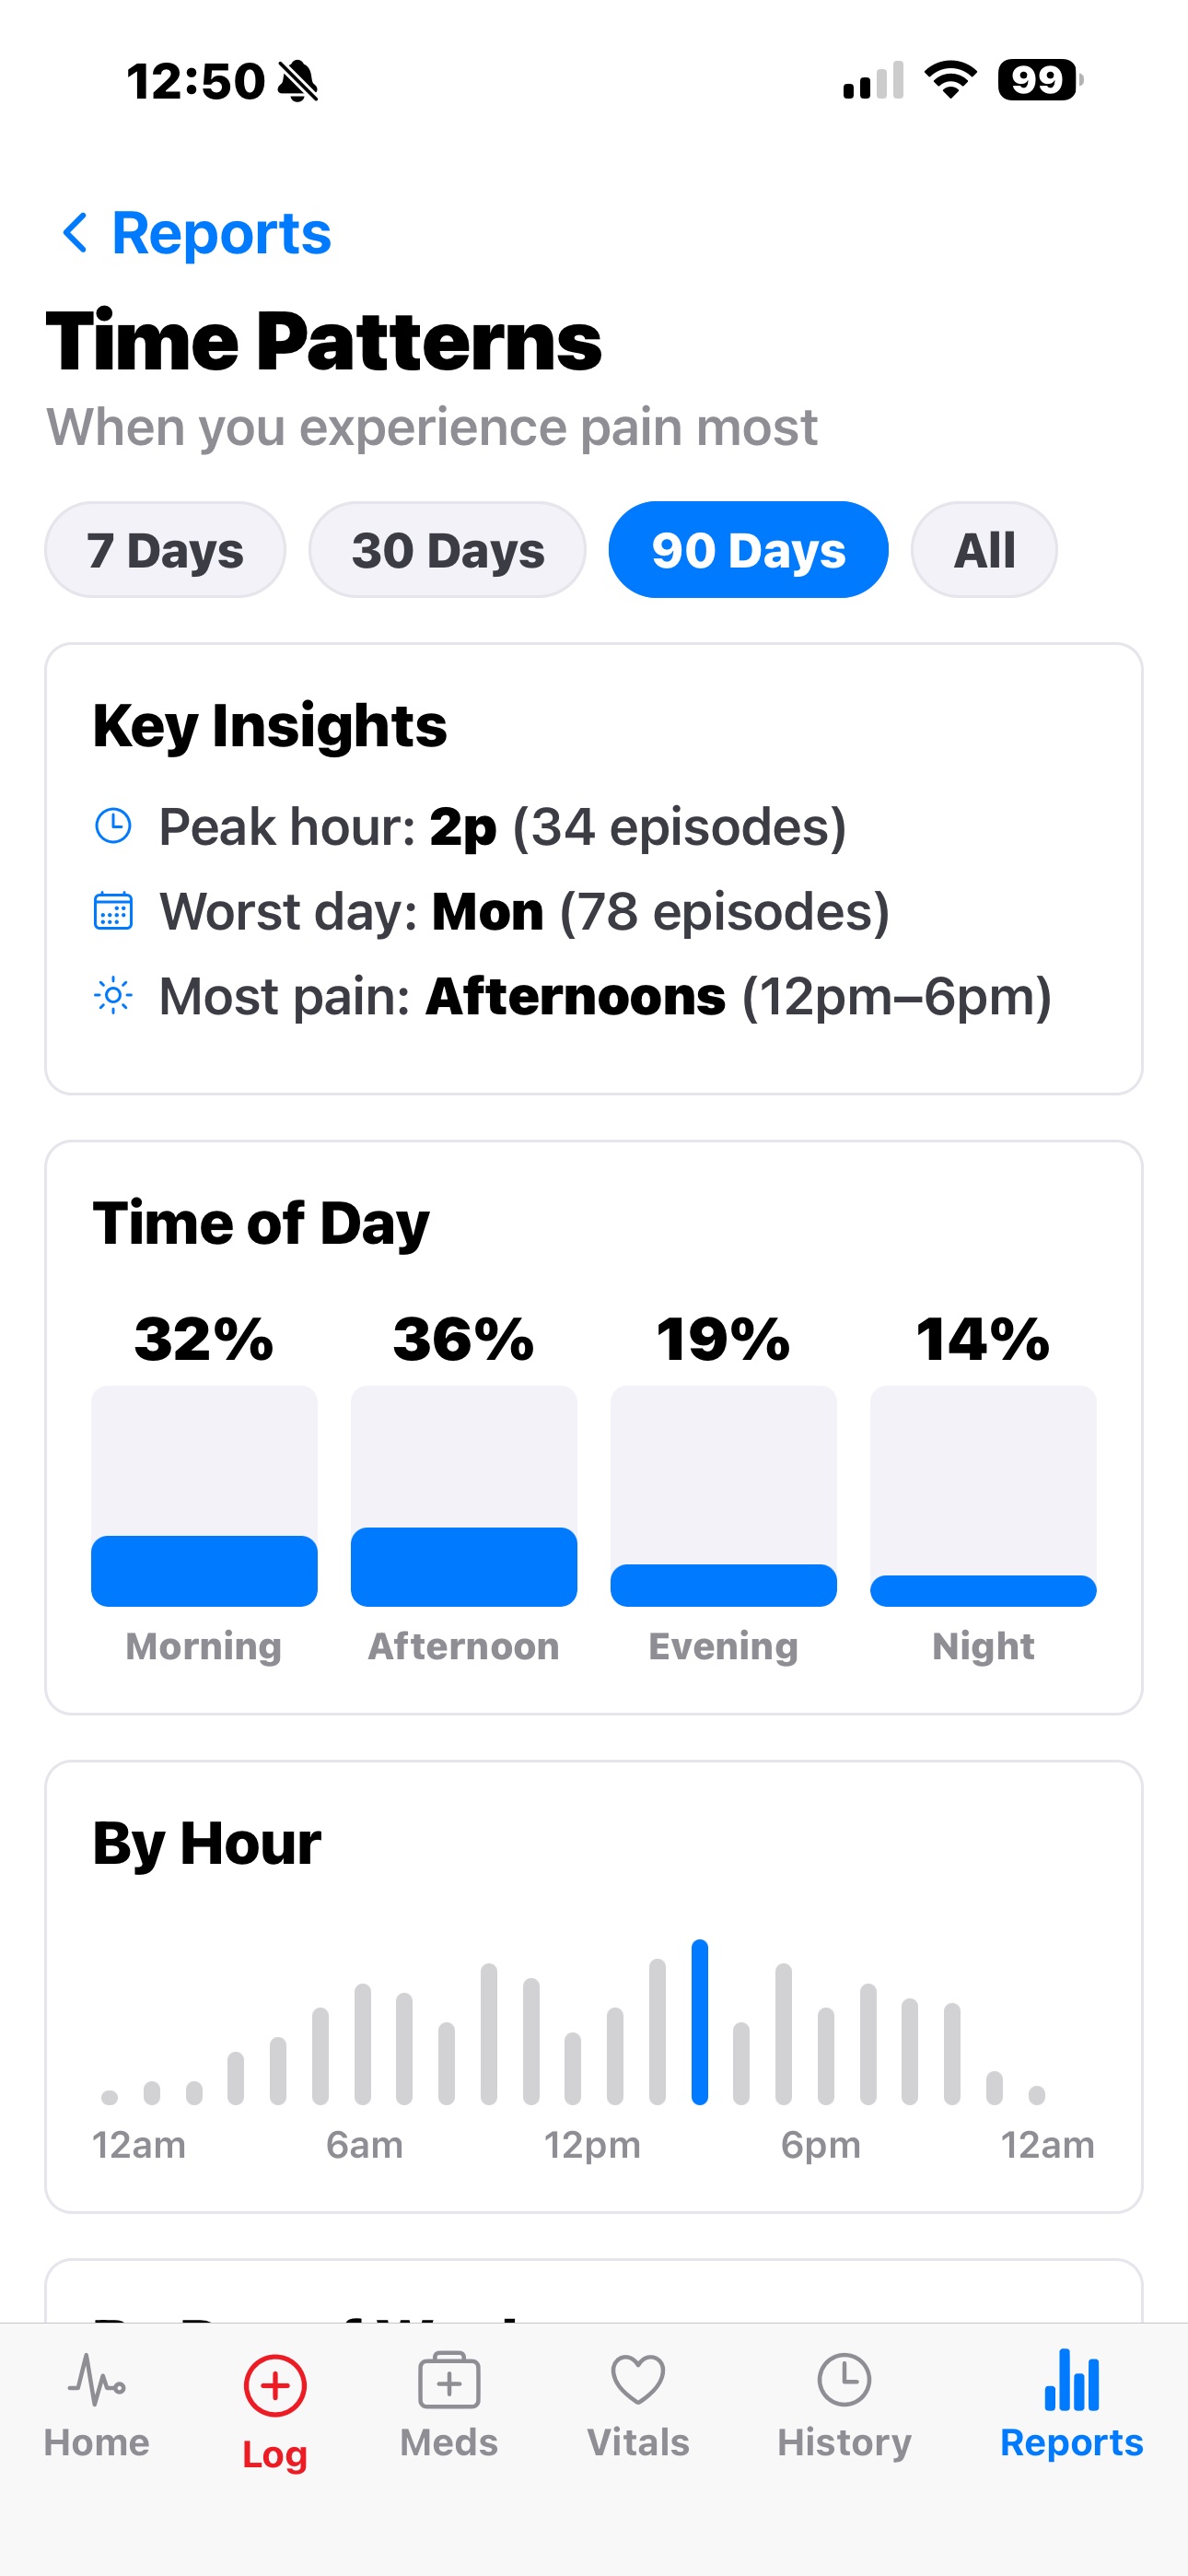
Hour-by-hour and day-by-day patterns. Peak hour, worst weekday, time-of-day breakdown.
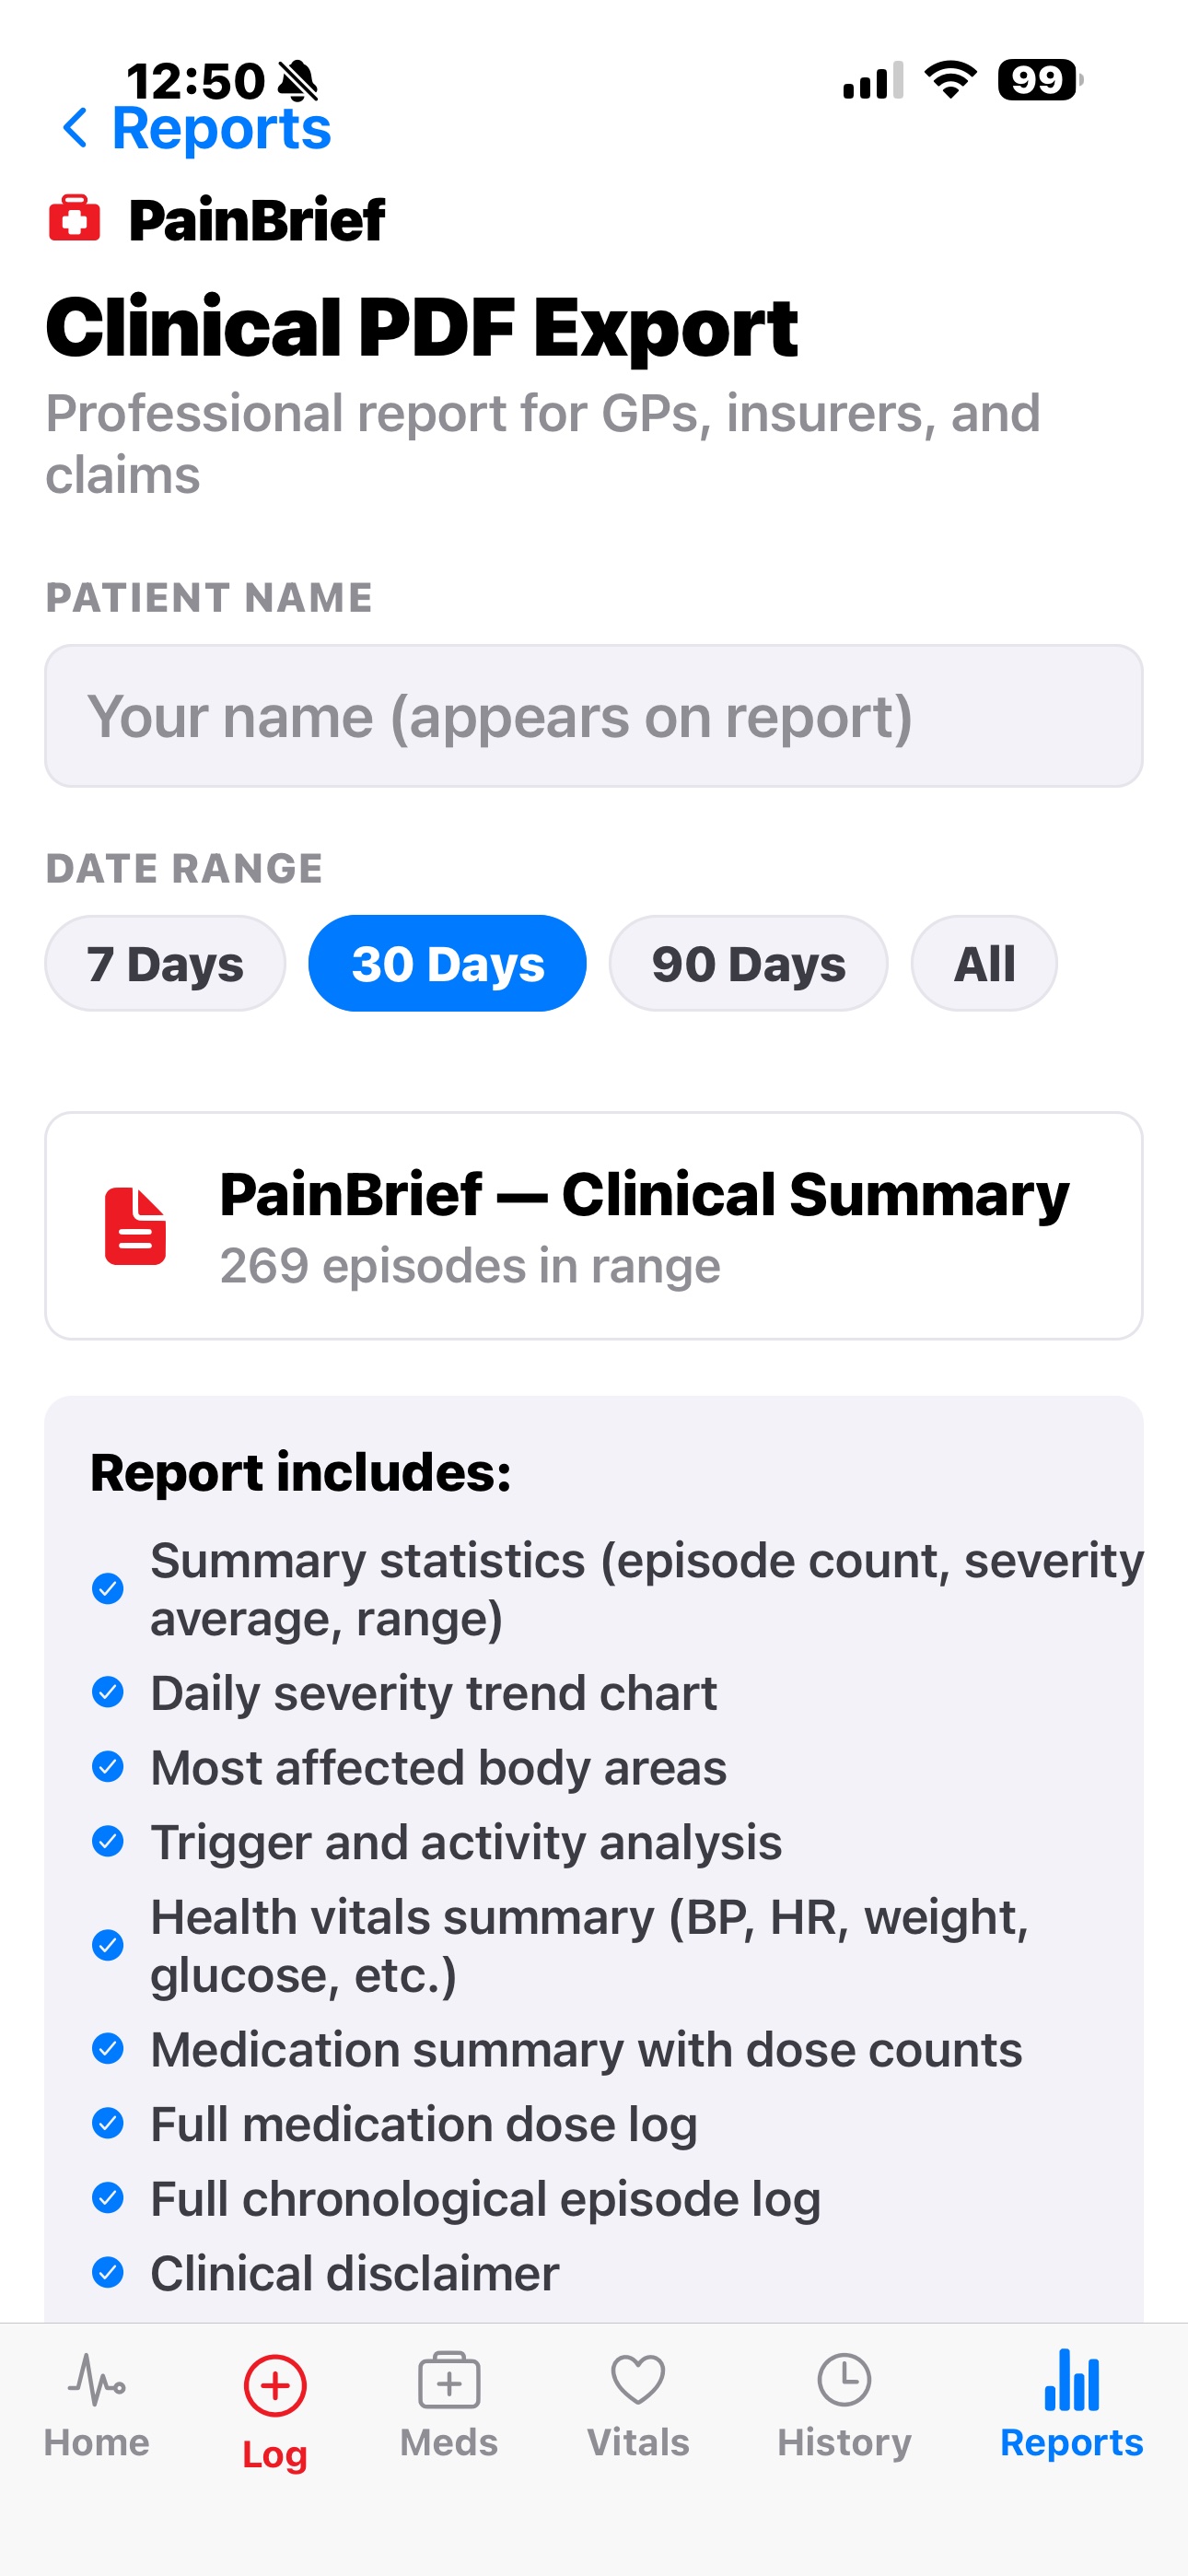
A polished multi-page report — charts, body heat map, full episode log, vitals, and medications, ready to share with your healthcare team.
Trigger Analysis, Time Patterns, Timeline / Journal, and Clinical PDF Export — all unlocked together, all with the one purchase.
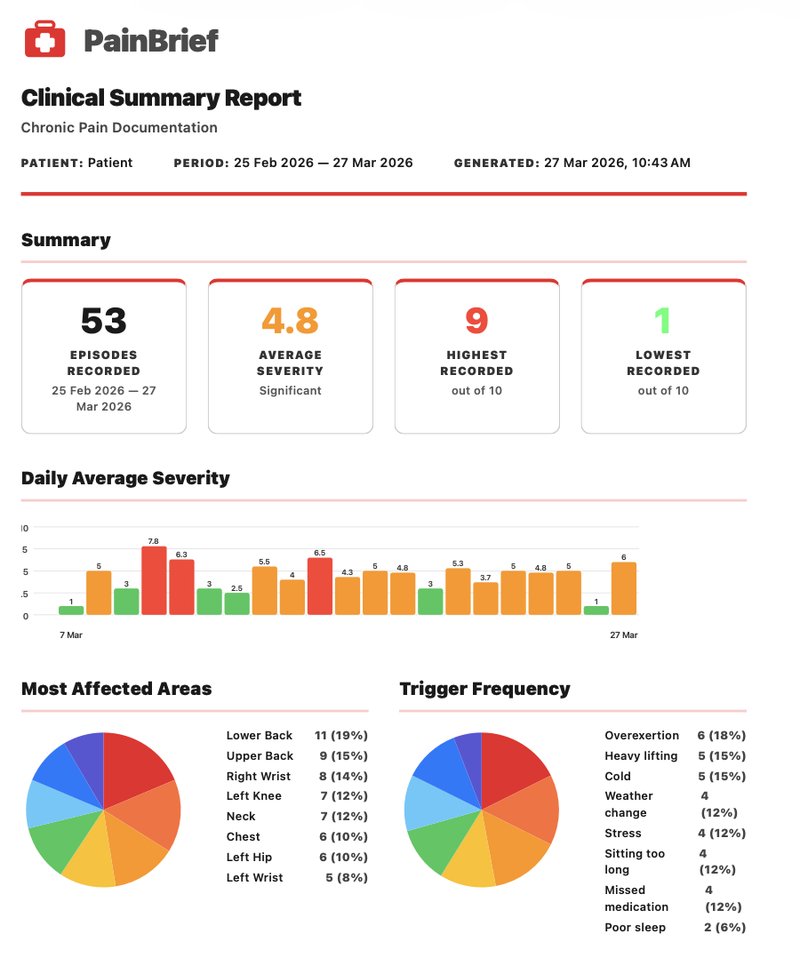
A real PainBrief Clinical Summary — charts, trends, medications, and a full episode log, ready to share.
Tap the body map, rate severity, note triggers and relief. Takes under a minute.
See trends across days, weeks, and months. Understand what makes things better or worse.
Create professional PDF summaries for your GP, specialist, or personal records.
See the full Privacy Policy for specifics on HealthKit and in-app purchases.